Get our list of the 12 field service KPIs that boost efficiency, customer satisfaction, and your bottom line.
The most successful service businesses run on data. Field service KPIs (Key Performance Indicators) are your dashboard, giving you a real-time view of your operational efficiency, customer satisfaction, and most importantly your profit margins.
This guide offers a range of field service KPIs that matter for HVAC business owners, how to track them, and what actions you can take to improve performance.
What Are Field Service KPIs?
Field service KPIs are indicators of how well your operations are performing. Common field service KPIs include first time job completions, on-time arrivals, average travel time, and customer satisfaction. They give you insights into how your field services teams and techs and contributes towards your overall company goals.
I like to think of KPIs as the link between your team’s daily actions, your customer’s happiness, and your overall company performance.
KPIs aren’t just metrics on a spreadsheet. Metrics are simply measurements of work (like number of jobs completed), they tell you what’s happened. KPIs tell you how your whole business is performing against your goals.
Types of KPIs
You don’t want to track every single aspect of your business in granular detail with KPIs. Instead, focus on a handful of metrics that you know impact your bottom line. FIeld service KPIs tend to fall into three buckets:
- Operational & Efficiency KPIs: The nuts and bolts of your dispatch, scheduling, and service process.
- Customer & Quality KPIs: How your customer perceives your work (on-time arrives, first time compilations).
- Financial & Business KPIs: Your team’s ability to drive revenue and operate profitably.
Metrics vs. KPIs
Metrics are measurements of performance. For example, distance traveled between jobs, time to complete jobs, number of jobs completed in a time period. They give you the data to inform your field service KPIs.
12 Field Service KPIs That Drive Growth
1. First-Time Fix Rate (FTFR)
At ShareWillow, we’ve worked with over 200 service business and this is the #1 KPI that matters. First-Time Fix Rate measures the percentage of jobs completed successfully on the first visit (so without a callback).
Callbacks are a killer for service business. When a job is completed the first time around you cut costs (no driving back to the job), boost efficiency (you can complete more net new jobs), and leave a happy customer (as their problem is solved).
To calculate it, divide the jobs completed on the first visit by the total number of jobs and multiply by 100. So if you completed 100 jobs last month and had 11 callbacks, your first time fix rate would be 89%.
2. Repeat Visits / Callbacks
This is the painful inverse First-Time Fix Rate. It counts the number of times you have to return to a site, typically within 30 or 60 days, for the very same issue. Callbacks destroy your profit margins and, just as importantly, your customer's trust in your work.
3. Technician Utilization Rate
The Utilization Rate tells you the percentage of your tech’s time is spent in the field doing billable work versus non-billable time like travel or admin.
Tracking this KPI helps ensure you’re optimizing your workforce productivity. A low utilization rate is a major red flag and any time your tech’s are spending on non-billable work is reducing your margins. To improve this KPI, focus on areas like scheduling, dispatching, and streamlining any administrative work your techs need to complete between jobs.
4. Mean Time to Repair (MTTR)
Mean Time to Repair measures the average actual time spent fixing the problem once your technician is on-site with the customer. Of course, not every job is predictable and you’ll have outliers, but if you find techs are spending too much time on straightforward tasks it might signal a need for better training, the right tools, or a more accurate diagnosis of the issue before the visit.
5. Average Travel Time
Here’s where your dispatch planning and routing really starts to pay off. Average Travel Time is exactly what it sounds like, the amount of time your techs spend in the truck travelling between jobs. Every minute spent in the truck lowers your Tech Utilization Rate.
If travel time is high, this points to inefficient routing and dispatch.
6. SLA Compliance Rate
If you work with commercial clients, this one is critical. Almost every commercial contract will have a Service Level Agreement (SLA) which details the number of jobs you’ll complete within a certain timeframe. Missing SLAs can mean financial penalties, lost contracts, and a damaged reputation.
Ideally with SLA Compliance Rate, you’ll be hitting 100%. But if it dips for any reason you’ll need to understand why and clearly explain it to your client.
7. Average Response Time
In a competitive market, speed wins. There are a couple of ways you can look at this metric:
- The average time between a customer’s initial service request and your first response (e.g. a call to start the booking process). A common benchmark here is aiming to get back to everyone within 24 hours.
- The time between a customer’s initial request and your tech arriving to complete the job.
The bigger the gap between a potential customer’s outreach and your response, leaves them more time to put out a call to a competitor.
8. Customer Satisfaction (CSAT)
This is the most direct measure of customer happiness. It’s usually a simple post-job survey asking, "On a scale of 1-5, how satisfied were you with our service?" It gives you immediate feedback on every single job.
Some businesses choose to focus on reviews here too, paying attention to the number of 5-star reviews each tech gets for their work.
9. Net Promoter Score (NPS)
NPS is different from CSAT. It measures loyalty, not just satisfaction, by asking one question: "How likely are you to recommend us to a friend or colleague?" This score tells you who your promoters (brand evangelists) and detractors (brand killers) are.
10. Contract Attach Rate
Recurring revenue is how you build a predictable, scalable business. The Contract Attach Rate is the percentage of one-off service or install jobs that your team converts into an ongoing maintenance contract. This is the key to escaping the cycle of a project-based business.
Maintenance plan upsells are also a great incentive for your technicians. If you really want to highlight the importance of these to your business, offer tech a cash incentive for each job they attach a contract to.
11. Average Revenue Per Job / Per Technician
A simple but powerful financial metric. This tracks the average dollar amount you bring in for each job or each tech per day. It helps you quickly understand which of your techs are strong at upselling or which types of jobs are most (or least) valuable to your business.
12. Parts Consumption / Inventory Accuracy
This KPI measures how quickly you use parts and how accurate your truck or warehouse inventory is. Poor inventory management can directly affect other KPIs like your First-Time Fix Rate if techs are showing up without the right parts. On the flip side, if you have too much inventory, it can mean your cash is tied up in parts you’re not actually using.
Profit sharing
made simple.
Give your team a stake in the company’s success. ShareWillow helps you create and manage profit-sharing programs that motivate employees and drive business results.
How to Choose the Right KPIs for Your Business.
This list is a great menu, but you should only order what you're going to eat. The right KPIs for you depend 100% on your business goals and what you feel with move the needle.
You should align KPIs with the most important metrics and goals in your business right now. If you want to increase your profitability per job, you could focus on First-Time Fix Rate or Contract Attach Rate to drive upsells.
If your goal is to increase your returning customer rate, then Average Response Time, NPS, and Customer Satisfaction could be the right ones to focus on.
Next, check for data availability to make sure you can actually track KPI performance. Many of these metrics will be available in your field management software like ServiceTitan or Jobber.
And finally, make sure your chosen KPIs are actionally and create a clear list of steps you can take to improve that KPI.
How to Turn Your KPIs into Profit
Tracking KPIs alone is useless, acting on them is where you get paid. The single best way to act on your KPIs is to align your team's incentives with your company's goals.
KPIs fall down when all you do is show them to your team on a whiteboard or online dashboard. To drive real change and improvement, you need to give your team a reason to improve the KPIs — so when your techs win, your company wins.
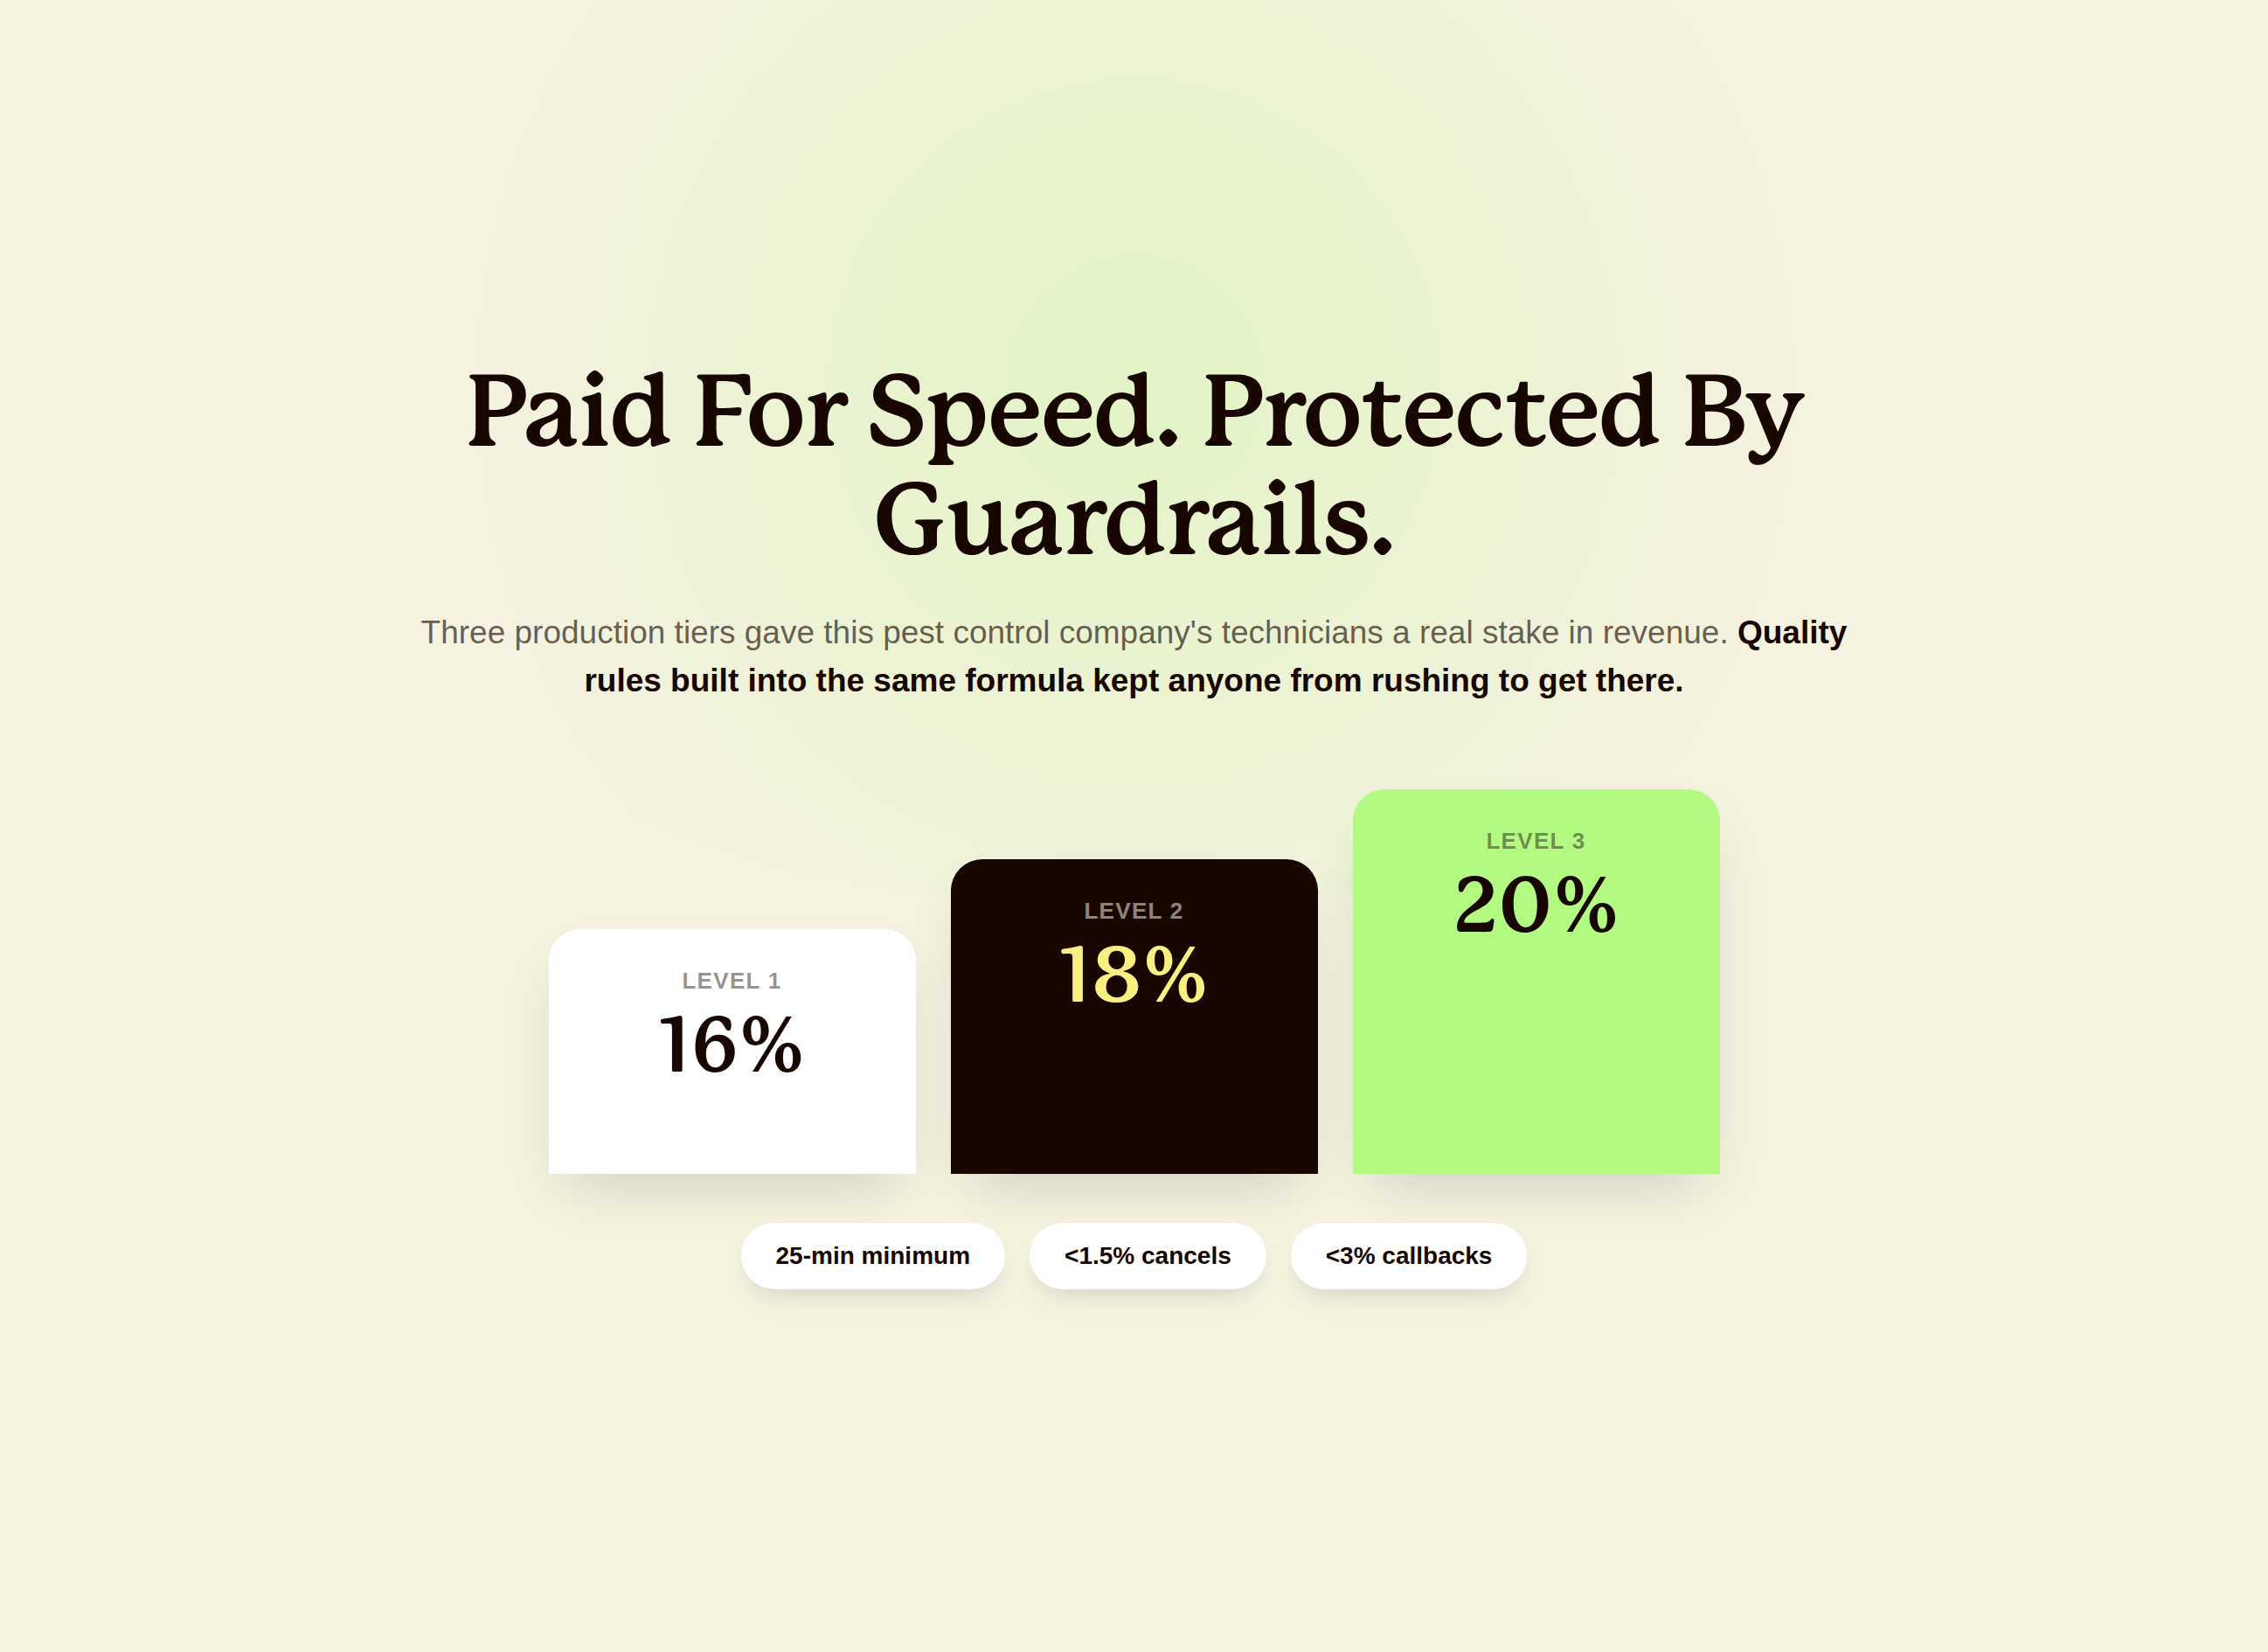
If your goal is to reduce callbacks from 18% to 10%, you can launch a performance bonus (SPIFF) for every tech who maintains a 90%+ First-Time FIx Rate for the month. Suddenly, your techs get very interested in stocking their trucks correctly. They double-check their work before leaving. They call the office for support before giving up. The KPI improves because the incentive is aligned with the goal.
This is exactly why we built ShareWillow. Building these incentive plans doesn't have to be a nightmare where you spend hours every week updating spreadsheets. We've worked with over 200 service businesses to build commission and bonus plans that drive real growth.
ShareWillow is the simplest platform to help you design a plan based on your actual data, launch it to your team, and manage it so everyone sees exactly how they can win. Book a call with our team here.
Where Most KPI Programs Go Wrong
Many owners get excited, build a dashboard, and then get overwhelmed and that’s it — the KPIs never get actioned. Here are three mistakes to avoid:
- The first pitfall is analysis paralysis. This is when you track 40 different metrics but act on zero. Remember the 5-7 Rule. Stick to your core KPIs.
- The second is dirty data. This happens when your techs aren't logging job statuses correctly, so all your numbers don’t line up The fix? Train your team on why accurate data matters and how it could impact their performance pay.
- Finally, the most common mistake is measuring for measurement's sake. You have all the data, but you never act on it. If a KPI doesn't have a specific action or an incentive tied to it, stop tracking it. It's just noise.
Final Thoughts
Stop flying blind. Your Field Service Management software is collecting a goldmine of data every single day. It's time to put in into action to drive growth for your business.
The path to a more profitable service business is simple. First, measure what matters by focusing on 5-7 core KPIs. Second, act on what you measure. And the best way to act is by incentivizing your team to improve those specific numbers.
Your KPIs tell you what to fix. A smart incentive pay makes sure it gets fixed.
Conclusion
Create incentives
that
drive results
You shouldn't need complex equity plans to align your team. ShareWillow makes it simple to create transparent profit-sharing programs that motivate employees and grow your business.

Incentive plans to help
small businesses thrive.
.png)
"I was able to leverage the knowledge of the ShareWillow team to learn how other companies were designing their bonus plans. The template was extremely helpful."

Brian Tustin
Owner, First Rate Movers