
A multi-trade HVAC, plumbing, and electrical company wanted to trade rising base pay for real performance pay, until it found its new dashboard was only tracking one tune-up in eight a technician actually completed. Here's how three silent bugs nearly undermined the whole strategy before a single paycheck went out.
The Owner Who Wanted To Stop Raising Base Pay
A multi-trade HVAC, plumbing, and electrical company doing well over a million dollars a month in revenue had reached a point a lot of successful field service businesses eventually hit: some of its best technicians were already earning around fifty dollars an hour in base pay, and the owner didn't want the answer to "how do we keep our top people" to keep being "raise the base rate again." Base pay increases are permanent, they compound every year going forward, and they reward tenure more than they reward the specific things that actually move the business forward this month. What the owner wanted instead was performance pay: real, variable compensation tied to the actual behaviors that grow the company, so a technician's upside came from doing more of the right things rather than simply sticking around long enough for another raise.
That is a genuinely sound strategic instinct, and it's one more owners should have. The problem this company ran into wasn't the strategy. It was the dashboard sitting underneath it, and finding that out took building the plan first, then discovering the tracking meant to power it was quietly wrong in more than one place.
The plan itself was thoughtfully staged rather than dropped on the whole company at once. CSR pay came first, tied to booking rate and a handful of other measurable behaviors, with technician performance pay following in a second phase once the CSR side was proven out. A separate referral incentive, a flat spiff paid out once a referred customer's job was completed and paid, got layered in alongside the core plan as a way to reward the kind of word-of-mouth growth that doesn't show up cleanly in any standard field service report on its own. None of that structure was the problem. It was a sensible, phased rollout of exactly the kind of plan a company this size should be building. The problem was entirely in the numbers the plan was about to start reading from.
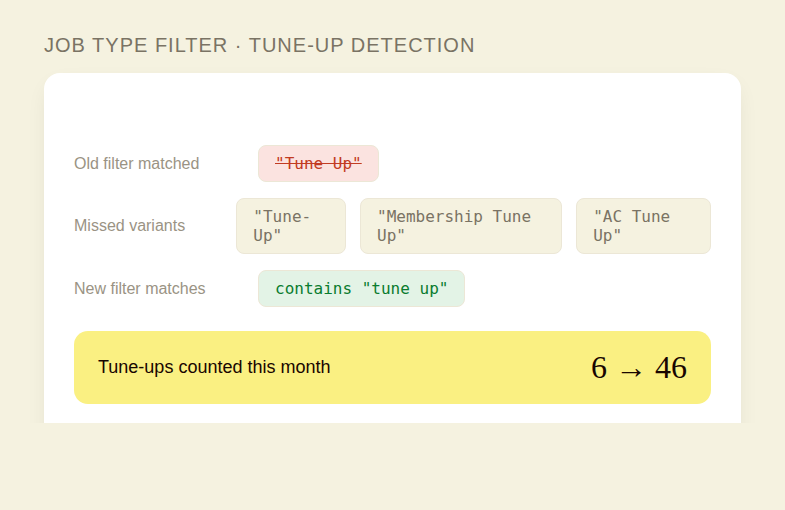
The first crack showed up in something that should have been simple to count: scheduled tune-ups. One technician's dashboard for the month showed six. Six tune-ups, on a technician doing full-time field work for a company running over a million dollars a month in volume, should have set off alarm bells on its own, and it did. When the team dug into why the number looked so low, the answer wasn't that the technician had a slow month. The job-type filter powering the dashboard was only catching jobs logged exactly as "tune up," with a space, matching that precise phrase. Every variant that didn't match character for character, "tune-up" with a hyphen, "membership tune up," "AC tune up," fell straight through the filter and never got counted at all.
Once the filter got rebuilt to catch any job type containing the phrase "tune up" in any of its common forms, the same technician's real count for the same month came back at forty-six. Not six. Forty-six. The dashboard had been seeing roughly one in every eight tune-ups that technician actually completed, and silently discarding the other seven, with no error, no warning, nothing to suggest anything was wrong except a number that, in hindsight, was obviously too low for a full-time technician at a company this size.
A Filter Problem Hiding Behind Two Bigger Numbers
The tune-up gap wasn't the only place the dashboard was undercounting real work. The install side of the report was even more dramatic in its own way: it was showing zero dollars in install revenue, and zero install jobs, for the period. Not low. Zero. Meanwhile the owner could point to real numbers from his own books: roughly $1.1 million in revenue the prior month, and about $280,000 so far in the current one, plainly including install work that his crews were actually out there completing every week.
"We did about $1.1 million last month and $280,000 so far this month, and the dashboard is telling me we did zero installs," the owner said. "That's not a rounding error. That's the report looking at the wrong thing entirely."
The install dashboard's problem traced back to a different root cause than the tune-up filter, but the shape of the failure was the same: a report that was technically running, returning a number, and passing every casual glance, while actually measuring something other than what it claimed to measure. In this case, the install report had originally been built as a filtered technician-performance view rather than a straightforward, unfiltered report pulled directly from ServiceTitan's own install job data. The filtering logic that made sense for one purpose was quietly excluding the very jobs the owner needed to see for another. The fix was to rebuild it as a dedicated, unfiltered install report, pulling straight from the source data instead of routing through a technician-scoped view that was never designed to answer this particular question.
A third gap showed up in the CSR booking-rate numbers, and it had a more mundane cause: one CSR was missing from the report entirely because of a name-mapping gap between the field service software and an external spreadsheet the booking-rate source pulled from. Her name simply didn't match between the two systems closely enough for the join to work, so her bookings existed in the real world and vanished in the report, the same silent-failure pattern showing up a third time in three completely different parts of the same dashboard.
It's worth noticing what these three bugs have in common beyond just failing quietly: each one originated at a seam between two systems that were never designed with each other in mind. The tune-up filter broke at the seam between however technicians and dispatchers happened to type a job type into the field service software and however precisely the dashboard's filter expected that text to be written. The install report broke at the seam between a view built for one purpose, technician-level performance review, and a completely different question being asked of it, company-wide install revenue. The CSR booking gap broke at the seam between the field service software's name field and an external spreadsheet's name field, two systems that had no shared, reliable identifier tying one CSR's record to the other. Seams like these are where this category of bug almost always lives, precisely because no single person owns the space between two systems the way they own a system individually.
Three separate bugs, three separate root causes: an overly literal text filter, a report scoped to the wrong purpose, and a data-mapping mismatch between two systems that were never quite talking about the same technician the same way. What ties them together isn't the specific cause. It's that every single one of them failed silently. None of them threw an error. None of them flagged themselves as broken. They just quietly returned a number that was wrong, and a wrong number that looks plausible on a dashboard is far more dangerous than one that looks obviously broken, because nobody has a reason to double-check a number that seems reasonable on its face.
Profit sharing
made simple.
Give your team a stake in the company’s success. ShareWillow helps you create and manage profit-sharing programs that motivate employees and drive business results.
Why The Strategy Only Works If The Data Underneath It Is Real
Here's what makes this story matter beyond the three individual bugs: the owner's entire strategic goal, shifting compensation from ever-rising base pay toward real performance pay, depends completely on the dashboard behind it being trustworthy. If a technician's real tune-up count is being tracked at roughly one-eighth its actual value, any performance-pay plan built on top of that number isn't rewarding performance. It's rewarding whichever technicians happen to log their jobs in whatever exact phrasing the filter was written to expect, which has nothing to do with how good they actually are at the job.
Left uncorrected, a bug like this doesn't just produce an inaccurate number. It actively undermines the exact goal the owner was trying to achieve. The whole point of moving away from automatic base-pay increases was to make pay reflect real, current performance instead of tenure. A performance-pay plan running on top of a dashboard that's silently discarding seven out of every eight tune-ups doesn't reward performance any better than a flat raise would. It just adds complexity on top of the same blind measurement, and arguably makes things worse, because now technicians believe their pay is tied to something specific and measurable when it's actually tied to a broken filter they have no way of knowing exists.
This is precisely why catching these three bugs before technician and CSR pay went live on the new plan mattered as much as it did. A performance pay platform is only as good as the data feeding it, and the data feeding it is only as good as the filters, mappings, and report scopes nobody thinks to double-check until a number looks obviously wrong. Six tune-ups looked wrong enough to investigate. Zero install dollars looked wrong enough to investigate. A missing CSR looked wrong enough to investigate. The dangerous version of this problem is the one that produces a plausible-looking number instead of an obviously broken one, the kind that would have sailed straight into a live pay period without anyone catching it.
For any HVAC, plumbing, or electrical company considering the same move this owner made, trading base-pay growth for real performance pay, the lesson isn't to avoid the strategy. It's a genuinely good one, and controlling pay inflation while still rewarding your best people is exactly the kind of problem incentive pay is built to solve. The lesson is to treat the dashboard powering that plan with the same scrutiny you'd apply to the plan's design itself. Pull a technician's real numbers from the source system independently, at least once, before trusting a report that's about to start deciding what people get paid. Ask whether a job-type filter is doing exact-text matching or genuinely catching every real variant a tech might log. Check whether a report scoped for one purpose, like reviewing an individual technician's performance, is quietly being reused for a different purpose it was never built to serve, like tallying company-wide install revenue. None of those checks take long. All three of them, in this case, were the difference between a performance-pay plan that actually measures performance and one that would have quietly measured almost nothing at all.
There's also a timing lesson worth pulling out on its own. All three of these gaps got caught during setup, before a single technician or CSR had been paid a dollar off the new numbers. That timing wasn't luck. It was the direct result of the owner and his team treating the pre-launch dashboard the same way they'd treat a new hire's first week: watching it closely, comparing what it reported against what they already knew to be true from their own books, and refusing to trust it just because it was live and producing output. A company that skips that step, that flips the switch on a new performance-pay dashboard and simply assumes the numbers are right because the system says so, is trusting software it has never actually verified against reality. The technicians and CSRs whose pay depends on that system deserve better than an assumption, and so does the owner who's betting his retention strategy on it.
Related reading
Conclusion
A performance-pay plan is only as good as the dashboard behind it. Verify the numbers before you trust them with someone's paycheck.
Create incentives
that
drive results
You shouldn't need complex equity plans to align your team. ShareWillow makes it simple to create transparent profit-sharing programs that motivate employees and grow your business.

Incentive plans to help
small businesses thrive.
.png)
"I was able to leverage the knowledge of the ShareWillow team to learn how other companies were designing their bonus plans. The template was extremely helpful."

Brian Tustin
Owner, First Rate Movers
