
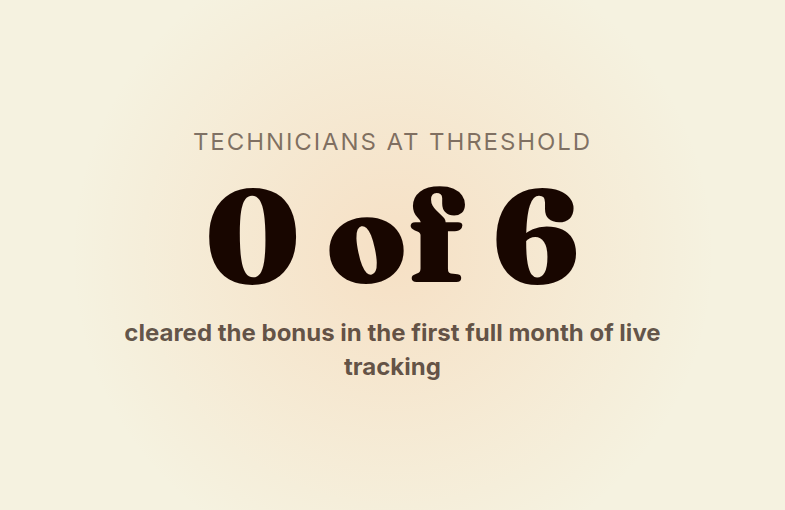
A residential pool service company built a tiered, revenue-per-hour bonus for its route technicians, then watched the first full month of live tracking end with zero payouts. The threshold wasn't wrong because the crew wasn't working hard enough. It was wrong because the data feeding it was.
A plan that made sense on paper
A residential pool service company running about half a dozen route-based technicians wanted to move away from a flat hourly wage as the only thing tying pay to performance. Pool routes are a strange business to incentivize well. Two technicians can work the same number of hours and produce very different revenue, because one is running a dense, tightly packed route of small weekly cleanings and the other is spread across a handful of larger accounts with more drive time between stops. A simple hours-worked bonus rewards nobody in particular. A simple revenue bonus rewards whoever happens to have the richest route, regardless of effort.
The company landed on revenue per hour as the fairest single number they could build a bonus around. It does not care how many stops a technician made or how big any one account is. It only asks how much revenue came out of every hour a technician actually worked. They built a tiered structure on top of it: anything under $110 in revenue per hour paid nothing, and the payout scaled up from there, reaching 5% of monthly revenue for technicians clearing $150 or more per hour. On a whiteboard, it looked like exactly the kind of plan that rewards real performance without punishing anyone for the shape of their route.
Then the first full month of live tracking closed out, and the owner pulled the numbers to calculate July's payouts. Not one technician had cleared the $110 threshold. Not the newest hire, not the technician who had been running the same route for years and knew every gate code and dog by name. Zero people qualified for a bonus, on a plan specifically designed to reward the people already doing the work.
That is the kind of result that makes an owner question everything at once. Did the crew suddenly get slower? Did the whole team quietly agree to take it easy the exact month a new incentive rolled out? Or was the number the plan was built on simply wrong. Most owners in this spot start by doubting their people. The more useful instinct, and the one that actually paid off here, is to doubt the meter before doubting the crew, especially when the miss is total and immediate rather than a handful of people falling a little short.
A threshold that exactly nobody can reach in its very first live month is a strong early signal that the number is measuring the wrong thing, or measuring the right thing badly, long before it is a signal that an entire team's work ethic changed overnight. That distinction matters for any pool and spa route business, or really any field service company paying technicians based on a per-hour or per-job efficiency number: the plan is only as trustworthy as the data pipeline sitting underneath it, and nobody finds out how trustworthy that pipeline is until real money is riding on it.
This is not a problem unique to pool routes. HVAC companies running per-technician efficiency bonuses, and facility managers who track a vendor's cost per work order, are leaning on the exact same kind of ratio: a dollar number divided by an hours number, pulled from two systems that were never designed to talk to each other. Anyone using revenue per hour, jobs per day, or cost per ticket as a pay or performance metric is one misattributed timecard entry away from the same blank-payout month this company had.
The meter was broken in two directions at once
The company's technicians clocked their hours in a separate timecard system from the one that tracked jobs and invoices. That split is extremely common in field service. The scheduling and billing software knows what got sold. A separate time-tracking app, often chosen for its GPS and route features, knows how long a technician was on the clock. Revenue per hour lives in the gap between those two systems, and that gap is exactly where the errors were hiding.
Drive time and job tagging inside the timecard system were getting misattributed for at least some technicians, which inflated the hours side of the equation without a matching increase in revenue. Pad a technician's tracked hours with time that should not have counted, or count time against the wrong job, and revenue per hour drops even though the technician did nothing differently. Multiply that across a full month of routes and it is entirely possible for a hard-working, efficient technician to show up on paper as someone who never got close to $110 an hour, when the truth is closer, or even the reverse.
The proof that this was a real data problem, not a real performance problem, showed up when the team went looking for anomalies on the other side of the ledger. One technician's numbers came back showing an eye-popping revenue-per-hour figure, in the neighborhood of $10,000 across roughly 12 hours. Nobody generates that kind of number legitimately on a residential pool route. That result only makes sense if hours were being undercounted or revenue was being attributed to the wrong technician, which meant the same broken pipeline that had zeroed out the whole team in one direction was also capable of manufacturing an impossible outlier in the other.
Two broken numbers pointing in opposite directions, discovered in the same review, is a pattern worth learning to recognize. It almost never means two unrelated coincidences. It means the underlying pipeline connecting job data to time data has a structural gap, and until that gap gets closed, every number that depends on both systems agreeing with each other is suspect, in either direction, for any technician on the route.
If you run a service business on two separate systems for scheduling and time tracking, and most do, it is worth asking three plain questions before trusting a per-hour metric with anyone's pay. Does drive time get attributed to the job a technician just finished, the job they are heading to, or nowhere at all? When a technician touches more than one job in a short window, does the time-tracking app split that block cleanly, or dump the whole block onto whichever job happened to be open when the clock ticked over? And does anyone ever pull an outlier report, the way this company did, looking for numbers that are impossibly high, not just suspiciously low? A broken meter rarely announces itself. It just quietly decides who gets paid.
The fix started with attribution. Instead of pulling revenue at the job level, which assumes every job got tagged and split cleanly, the company moved to attributing revenue at the invoice level and matched it against corrected time entries, so drive time and mis-tagged jobs stopped quietly padding or starving any one technician's hours. It is a less glamorous fix than redesigning the whole compensation plan, but it is the fix that actually mattered, because the plan itself, tiers, percentages, and all, was never the problem.
Profit sharing
made simple.
Give your team a stake in the company’s success. ShareWillow helps you create and manage profit-sharing programs that motivate employees and drive business results.
Redesigning around a slow week, not just a slow meter
Fixing the data closed one gap, but it exposed a second design question the owner had not fully considered when the plan first went live: what happens to a technician's bonus the one week a route runs long, a customer reschedules into a slower day, or a truck needs an unplanned repair. Under the original design, a single hard cliff each month meant one rough week could drag an entire month's average below $110 an hour and wipe out a bonus that nine days out of ten would have easily cleared the bar.
That is a fragile way to run an incentive, even once the underlying numbers are accurate. A plan that can be zeroed out by one bad Tuesday teaches technicians to fear variance instead of chase performance, and route-based service work has variance built into it by nature: weather, cancellations, a customer who wants to talk for twenty extra minutes at every visit. None of that reflects a technician getting worse at the job.
So alongside the attribution fix, the company started evaluating a rolling multi-month average instead of a single hard monthly cliff, averaging revenue per hour across a window of a few months rather than resetting the bar to zero every thirty days. A slow week still counts. It just gets absorbed into a bigger picture instead of erasing an entire period's incentive on its own, which is a much closer match to how route-based work actually happens over a season than a plan that treats every calendar month as an isolated test.
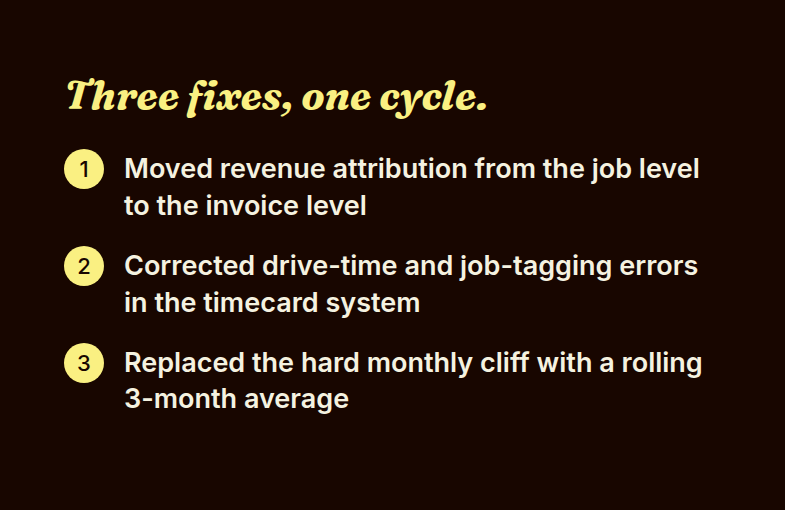
None of this required throwing out the original idea. Revenue per hour is still the right way to compare technicians running very different routes fairly, and a tiered payout that scales with performance is still a reasonable structure for a residential service business to build around. What changed was everything underneath the idea: where the revenue number comes from, how hours get counted, and how much a single bad week is allowed to cost an otherwise solid month.
Facility managers who oversee outsourced route-based vendors, whether that is pool service, landscaping, or HVAC preventive maintenance, run into a version of this same fragility when a contract ties a vendor's performance bonus to a single monthly efficiency number. A vendor who looks like they missed every target for a month is not automatically a vendor doing bad work. Ask what the target is averaged over, and ask what happens when one site visit runs long because of something outside anyone's control. The answer tells you a lot about whether the incentive was built to reward real performance or just built to look precise on a spreadsheet.
The practical lesson for any HVAC, plumbing, or field service owner watching a brand-new incentive plan produce a result that feels impossible, whether that is zero winners or one absurd outlier, is to resist the urge to relitigate the whole compensation philosophy on day one. Check the meter first. A platform built to pull directly from the job, time, and billing data a company already runs on will surface a broken attribution rule as a visibly wrong number, the same way it did here, instead of letting it quietly decide who does and does not get paid for months before anyone notices the pattern.
Related reading
- The $115 Award That Wasn't Moving the Needle: How a Pool Service Company Rebuilt Pay Around Revenue Per Hour
- How a Pool and Construction Company Tied Pay to Revenue Per Hour
- How to Calculate Bonus Pay: A Step-by-Step Guide to Fair and Motivating Compensation
- Companies with Profit Sharing: Who They Are & What They Offer
Conclusion
A bonus threshold nobody can hit is rarely a motivation problem, it's usually a measurement problem, so audit the meter before you blame the technician.
Create incentives
that
drive results
You shouldn't need complex equity plans to align your team. ShareWillow makes it simple to create transparent profit-sharing programs that motivate employees and grow your business.

Incentive plans to help
small businesses thrive.
.png)
"I was able to leverage the knowledge of the ShareWillow team to learn how other companies were designing their bonus plans. The template was extremely helpful."

Brian Tustin
Owner, First Rate Movers
