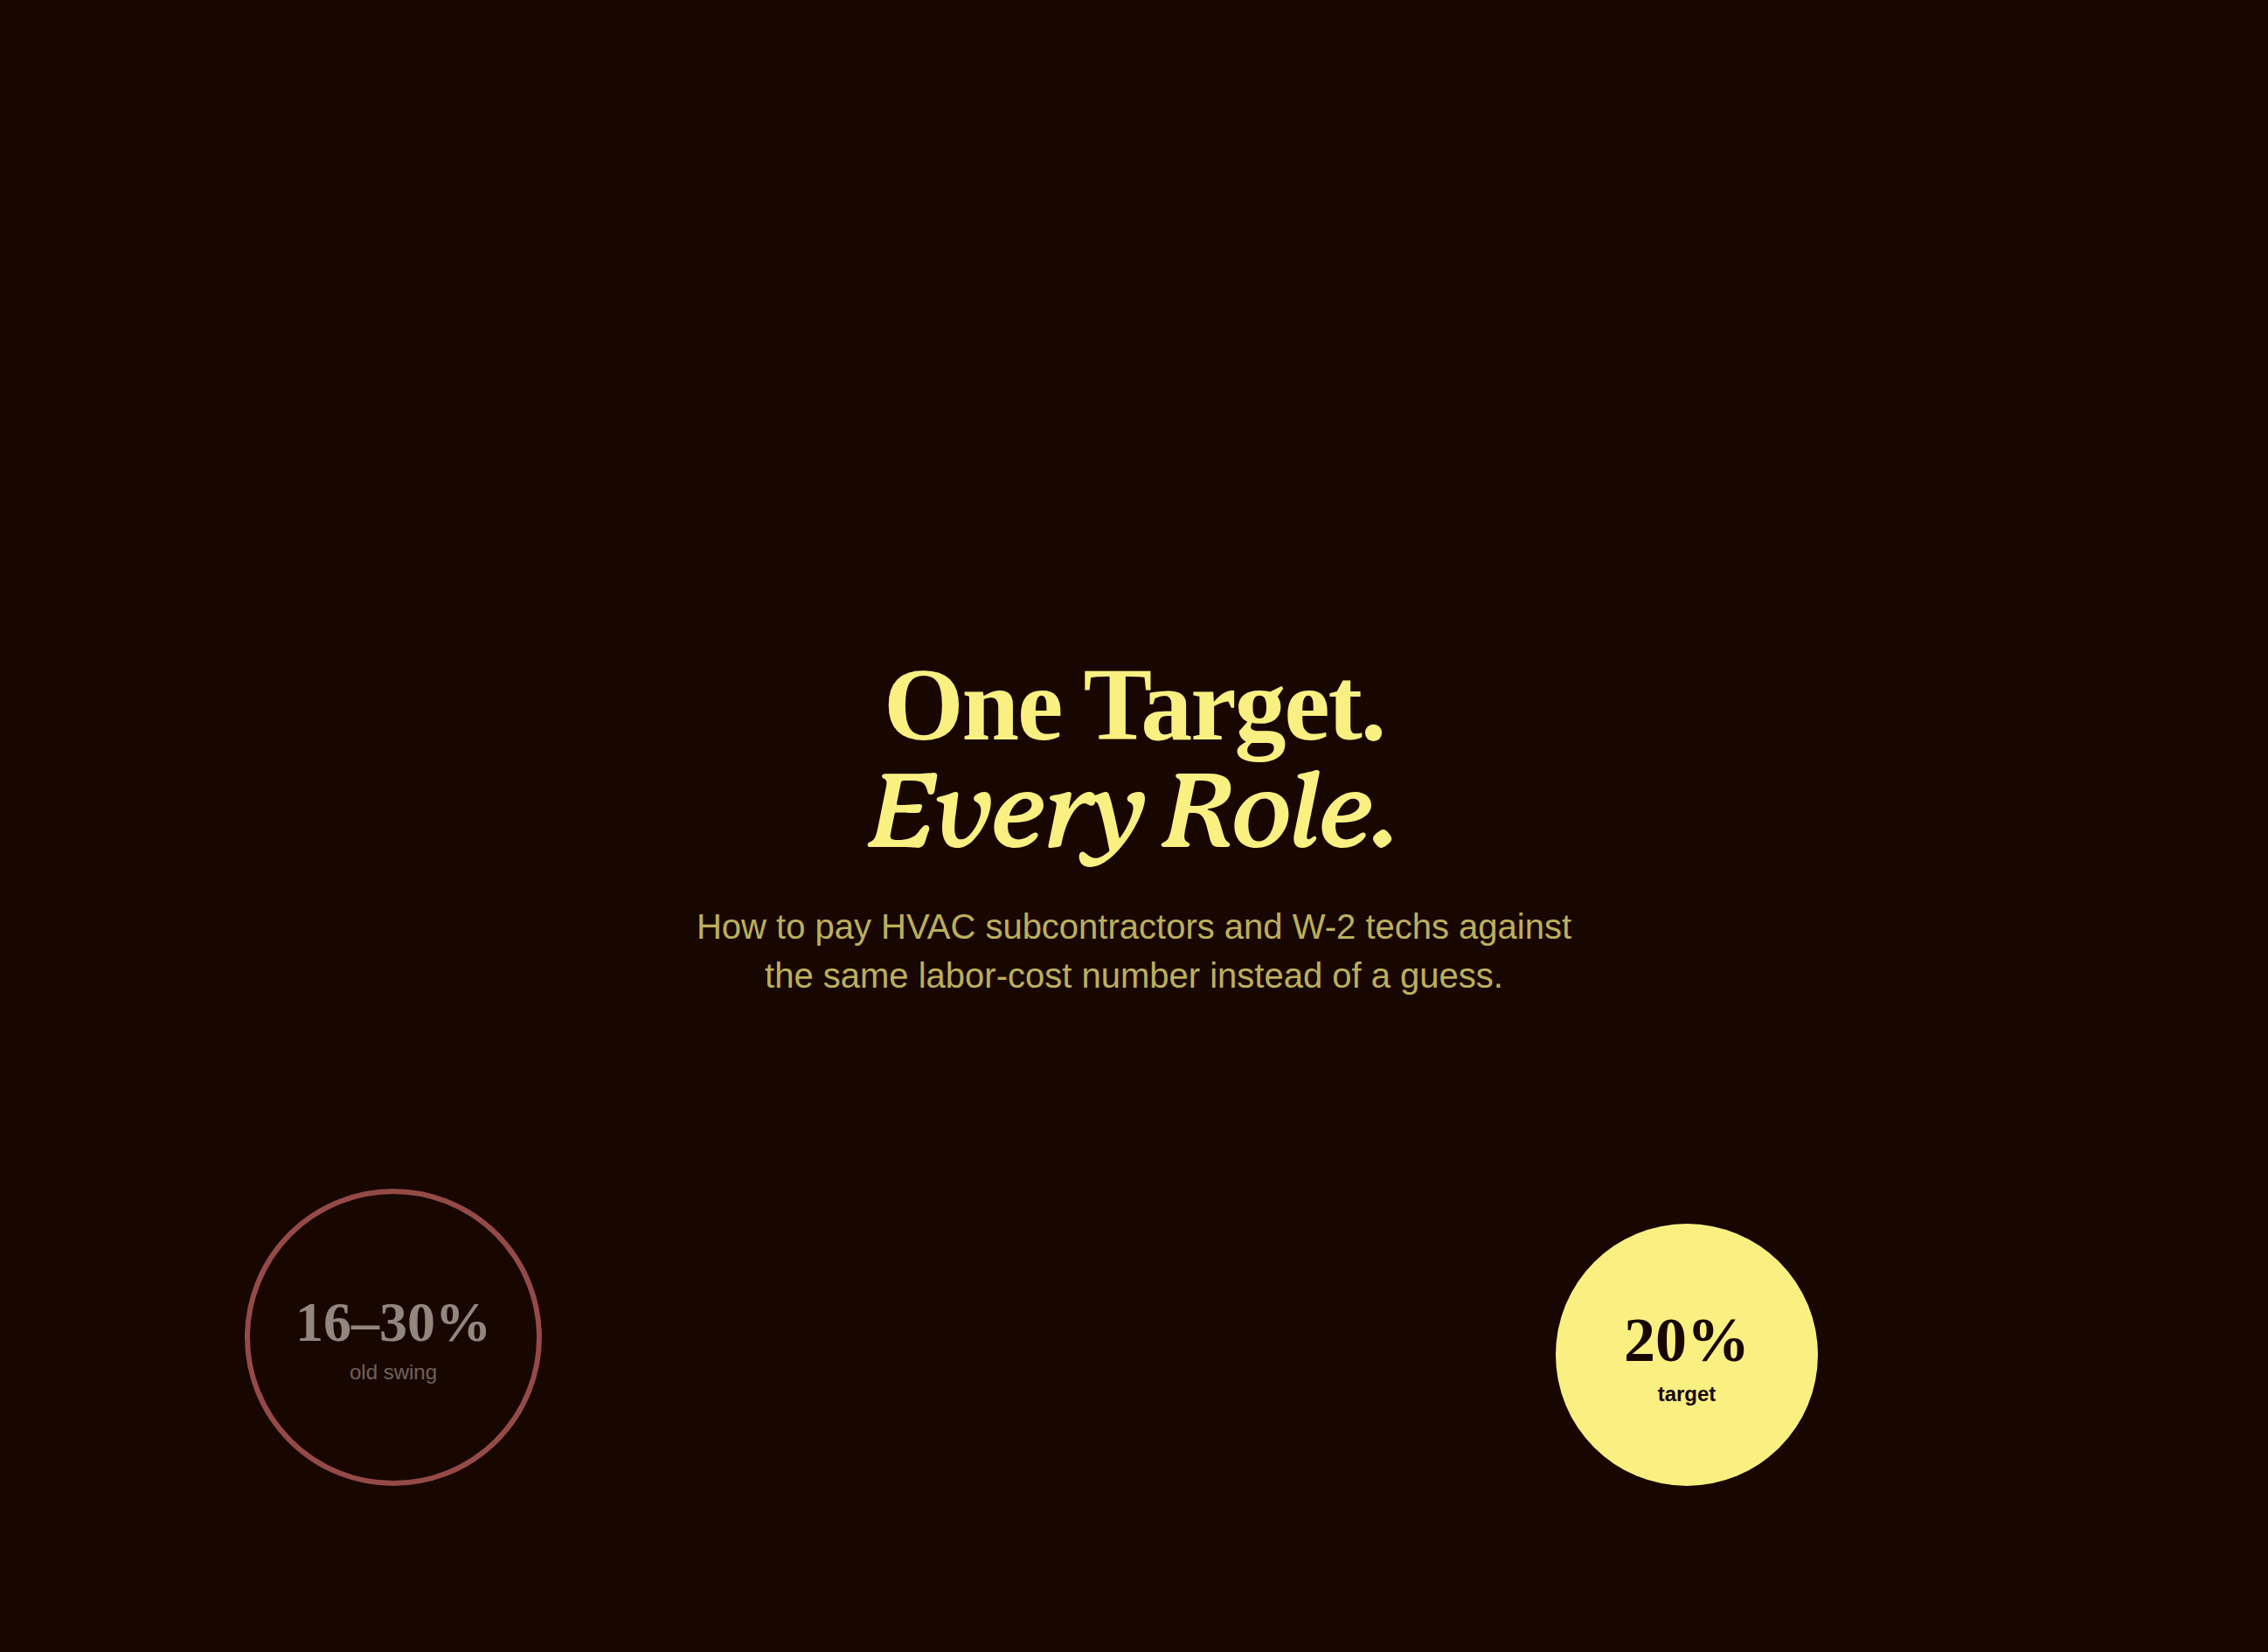
A family-owned auto and fleet maintenance shop had a callback problem everyone could feel and nobody could measure, split across two disconnected shop systems that had never been reconciled. Here is how standardizing callback attribution and billable-hours tracking surfaced a real baseline, and why 4.09 percent is the number the shop's new incentive plan is now built to pull down.
A callback is one of the most expensive words in auto repair, and also one of the most poorly measured. A vehicle comes back for the same problem, the shop eats the labor and sometimes the part, and everyone has an opinion about why it happened. What almost no shop has is an actual number: how often does this happen, as a share of total revenue, and is it getting better or worse. A family-owned auto and fleet maintenance shop, running a service-writer and garage-manager structure over several technicians, had never had that number either, until it started formalizing performance pay for the first time and the question could no longer be avoided.
The deeper problem was not just that nobody had calculated a callback rate. It was that the shop had no way to fairly attribute a callback in the first place. When a vehicle came back, there was no structured way to tell whether the root cause was a part that failed on its own, the kind of thing no technician could have prevented, or an installation or diagnostic error that belonged to whoever worked the vehicle. Without that distinction, any attempt to hold technicians accountable for callbacks was going to be either too lenient, letting real errors slide, or unfair, penalizing someone for a bad part they had no way to catch.
Two Systems That Never Talked To Each Other
A second, separate gap sat underneath the callback problem: the shop had no real visibility into billable efficiency, the ratio of hours actually billed to customers against hours technicians were paid for. That number is one of the most basic health metrics in auto repair, and this shop could not calculate it cleanly because the underlying data lived in two disconnected systems, Techmetrics and Fleetio, plus a separate time-clock system tracking actual paid hours. Technician hours logged in Fleetio had historically not been entered accurately at all, which meant even a motivated manager pulling numbers by hand would be working from data that was wrong before the math even started.
This is a more common situation than most shop owners want to admit. Growth happens unevenly: one system gets adopted for scheduling, another for job tracking, a third for payroll, and nobody goes back to make sure they all agree with each other. The cost of that misalignment is invisible until someone tries to build something that depends on all three systems telling the same story, which is exactly what happened here.
Building The Plan Around What Was Actually Missing
The plan ShareWillow built for this shop tackled both gaps directly instead of picking one. A tiered manager bonus on revenue forms the base of the structure: no award below $60,000 in a period, 50 percent of the award between $60,000 and $65,000, 75 percent between $65,000 and $70,000, and the full award above $70,000. That alone would have been a meaningful upgrade from no formal incentive structure at all, but revenue growth without a quality check is exactly the kind of incentive that can quietly reward volume at the expense of doing the job right the first time.
A Qualifier Built Around An Industry-Standard Number
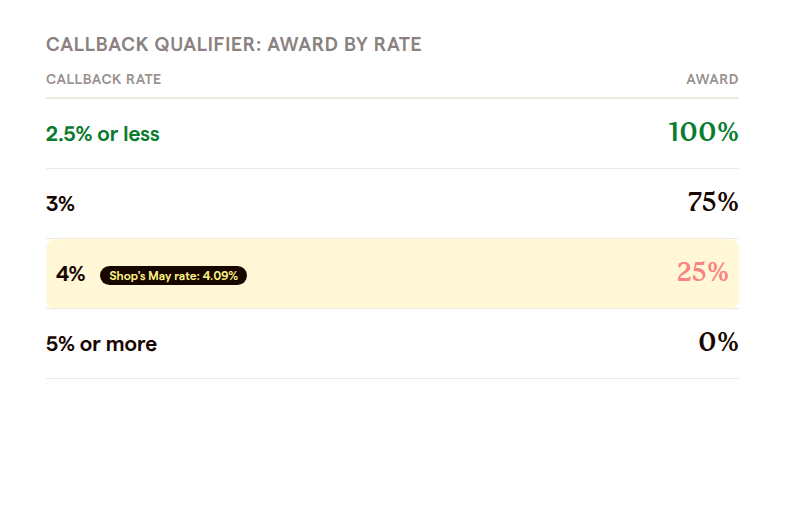
To keep the revenue bonus from rewarding volume alone, the plan layers a tiered warranty and callback qualifier on top of it: callback dollars, parts plus labor, measured against total revenue, with the award scaling directly against that ratio. A callback rate of 2.5 percent or less earns the full qualifier. 3 percent earns 75 percent of it. 4 percent earns 25 percent. 5 percent or worse earns nothing. The 2.5 percent target was not picked arbitrarily. It came directly from what the shop manager identified as the industry standard for a well-run shop, which matters: a qualifier benchmarked to a number the team already recognizes as fair is far more likely to be accepted than one that feels imposed from outside.
The plan also brought the billable-efficiency problem into the light for the first time, building a metric that reconciles hours from both Techmetrics and Fleetio against actual paid hours from the time clock, tracked at the individual technician level and at the company level simultaneously. That is a meaningfully different thing than what existed before, which was effectively nothing: no consistent number anyone could point to and say, this technician bills at this rate, this shop overall runs at that rate. Getting the two job-tracking systems to agree with the time clock was as much a data-cleanup project as it was a plan-design project, and it had to happen before the metric could be trusted enough to tie pay to it.
Fixing The Root-Cause Blind Spot
None of the callback qualifier math works if the shop still cannot tell a bad part from a technician error, so the plan included a change that has nothing to do with commission rates: standardized repair order notes and codes, so that every comeback gets consistently attributed to a cause going forward, part failure or technician error, instead of being a judgment call made differently by whoever happens to write it up. This is the unglamorous infrastructure work that makes a fairness-sensitive metric like a callback qualifier actually defensible. A technician who trusts that a bad part will not be pinned on them is a technician who will not quietly resent the whole plan the first time a callback happens that was not their fault.
The Baseline: 4.09 Percent
Because this plan is still in its design and rollout stage, there is no confirmed payout history to report, and presenting one would not be honest. What the shop does have now, for the first time, is a real number: the shop's actual May callback rate came in at 4.09 percent, measured the same way the new qualifier measures it, well above the 2.5 percent target. That number is not a disappointment so much as it is the entire point of the exercise. A shop cannot manage a callback rate it has never measured. Surfacing 4.09 percent as a real, current baseline is what makes it possible to build a plan that pulls that number down over time, instead of a plan built around a guess.
Profit sharing
made simple.
Give your team a stake in the company’s success. ShareWillow helps you create and manage profit-sharing programs that motivate employees and drive business results.
What A 4.09 Percent Callback Rate Actually Costs
It helps to be concrete about why a number like this matters beyond the plan document. Every callback carries at least two costs: the direct one, the parts and labor the shop eats to make it right, and a quieter one, the technician time and bay space that gets consumed redoing work instead of taking on new revenue. A shop running at 4.09 percent instead of a 2.5 percent target is not just paying for the difference in parts and labor. It is losing bay capacity to rework on a meaningful share of its jobs, capacity that could otherwise be billed to a new customer. That is part of why the revenue bonus and the callback qualifier are linked in the same plan rather than treated as two separate conversations: a shop chasing revenue growth without also controlling callbacks is, in a very real sense, growing revenue with one hand while quietly giving bay capacity back with the other.
None of this means 4.09 percent is a crisis number. It means it is now a visible number, tied to a specific target, inside a plan that gives the people closest to the work a direct financial reason to help close the gap. That shift, from a problem everyone senses to a problem everyone can see on the same dashboard, is usually the harder half of fixing it.
Why A Baseline Is Worth Publishing Even Without A Result Yet
It would be easy to wait on a story like this one until there is a tidy after-number to report alongside the before. But the honest version of this story is more useful to another shop owner precisely because it stops at the baseline. Most auto repair shops running an informal or no incentive structure are sitting on some version of this exact situation: a callback problem they can feel but cannot quantify, and a billable-efficiency number that would require reconciling two or three systems that have never been asked to agree with each other before. Watching what it actually took to get to a single trustworthy number, standardized RO coding, a reconciled billable-hours metric across two platforms and a time clock, a qualifier benchmarked to a number the team already respects, is a more useful roadmap than a payout figure would be on its own.
There is also a structural reason to expect this plan to move the number. A callback qualifier with no teeth, one that does not meaningfully change a technician's take-home pay, tends to get ignored the same way a posted policy on a breakroom wall gets ignored. A qualifier that scales an already-earned revenue bonus up or down based on callback rate is different: it is not a separate bonus a technician can shrug off, it is a real percentage of money they were already on track to earn. That is the kind of design that tends to actually change behavior on the shop floor, not just on paper.
What Other Shops Running Multiple Systems Should Take From This
The specific software names here, Techmetrics and Fleetio, are almost beside the point. Nearly every growing field service or repair business ends up with some version of this same fragmentation: a job-tracking system, a scheduling system, a payroll or time-clock system, none of which were built with the assumption that someone would eventually need all three to agree in order to calculate a single fair metric. The instinct is often to wait for a single unified platform before building any kind of data-driven incentive plan. This shop's experience argues for the opposite: reconcile just enough of what already exists, standardize the handful of fields that actually feed the metrics that matter, callback attribution and billable hours in this case, and build the plan on top of that, rather than waiting on a system migration that may never fully happen.
For an auto and fleet shop still running on a gut sense of its own callback problem instead of a real number, the lesson from this account is not about the exact tier thresholds or the exact qualifier percentages. It is that the number is knowable, usually within a few weeks of standardizing how comebacks get logged, and that knowing it, even before a single dollar of bonus has paid out differently, is what makes it possible to build a plan that actually closes the gap instead of guessing at one.
Related reading
Conclusion
There is no confirmed after-number yet, and presenting one would not be honest. What exists now, for the first time, is a real baseline: a 4.09 percent callback rate against a 2.5 percent target, a tiered qualifier that ties real pay to closing that gap, and a billable-efficiency metric reconciled across two systems that had never agreed with each other before.
Create incentives
that
drive results
You shouldn't need complex equity plans to align your team. ShareWillow makes it simple to create transparent profit-sharing programs that motivate employees and grow your business.

Incentive plans to help
small businesses thrive.
.png)
"I was able to leverage the knowledge of the ShareWillow team to learn how other companies were designing their bonus plans. The template was extremely helpful."

Brian Tustin
Owner, First Rate Movers