
A route-based field service company discovered a technician's timesheet showing 200 hours in one week, and traced that single broken number into two more hidden data problems quietly distorting how the business measured performance. Fixing all three turned a flood of false alarms into a handful of numbers worth trusting.
The week a technician "worked" 200 hours
A small, route-based field service company running three technicians was using a handful of operational metrics to manage its team day to day: hours worked, revenue per mile driven, and a flag that alerted a manager whenever an invoice went unpaid long enough to warrant a personal check-in with the customer. None of that is unusual. Most route-based service businesses, whether they are in HVAC, pest control, water treatment, or another recurring-service trade, lean on exactly these kinds of numbers to keep tabs on a team that is scattered across a territory most of the day.
The trouble started when one of those numbers stopped making any sense. A weekly time report showed a technician logging 200 hours in a single week. There is no honest way to work 200 hours in seven days, and the operations lead knew it the moment he saw it. But a number that absurd sitting inside a system that also feeds pay and performance decisions is not just a curiosity to shrug off. It is a signal that something underneath the reporting is broken, and if one number is that broken, the manager has to assume others might be too.
It would have been easy to treat the 200-hour week as an isolated glitch, correct that one technician's total by hand, and move on. Plenty of businesses do exactly that: they patch the visible symptom and never ask what else the same broken mechanism might be touching. To this company's credit, the operations lead treated the impossible number as a warning sign about the reporting pipeline itself, not just about one week's timesheet, and that decision to dig rather than patch is what turned up the other two problems before they caused real damage.
The root cause turned out to be almost mundane, which is exactly how these things usually go. Time entries for days off were showing a value of "23:59" instead of a blank or a zero, and when those entries got summed into a weekly total, they inflated the hours dramatically. A single technician's days off, meant to represent no work at all, were instead adding nearly a full day each to his weekly total. Multiply that across a handful of days off in one week, stack it on top of real hours worked, and 200 becomes an achievable, if absurd, output of a bad summing rule.
That was not the only issue hiding in the data. The company's revenue-per-mile metric, used to gauge how efficiently a technician's route was running, was quietly being corrupted by a vehicle record that had been renamed and duplicated at some point. Mileage tied to that vehicle was not being captured correctly, which meant the miles driven looked artificially low relative to the revenue generated, and revenue-per-mile came out looking artificially high. A manager glancing at that number would conclude a route was running unusually efficiently, when really it was running through a broken meter.
A third metric had its own quieter problem. The flag meant to alert a manager to a customer with an unpaid invoice was firing far more often than it should have, because it treated any invoice not yet marked paid as a problem the moment it crossed the due date, with no allowance for the normal lag between a customer sending an e-transfer and that payment actually getting recorded and marked in the system. The result was a flood of false alarms, invoices that were, in reality, already paid or about to be, but that still showed up as urgent manager-contact items simply because nobody had built in a reasonable grace window.
Three unrelated problems, discovered in the same review, is not actually a coincidence. It is what tends to happen once a business starts genuinely auditing its own reporting instead of trusting it by default. Most companies never go looking unless something forces the question, the way an obviously impossible number forced it here. The technicians in this case were not doing anything wrong. They were showing up, working real routes, and getting billed and measured through a reporting layer that had quietly accumulated three separate small defects, each one invisible until someone had a reason to look closely at the numbers it was producing.
Three different breaks, three different fixes
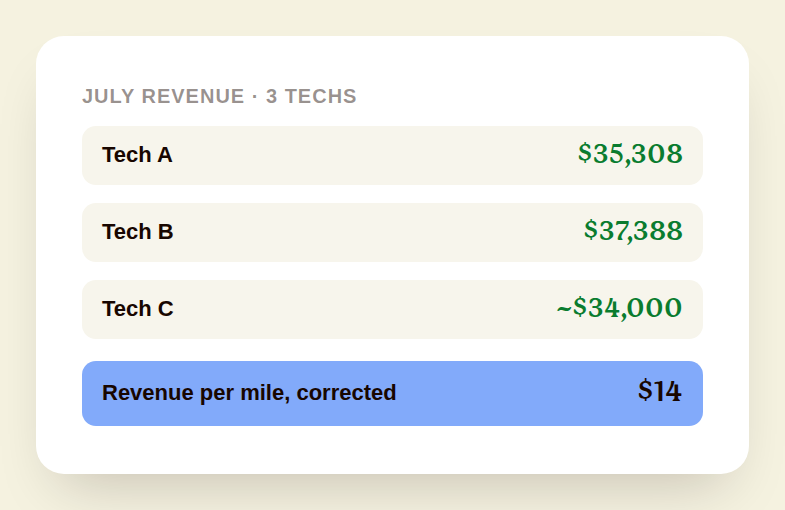
None of these three problems shared a root cause, which meant none of them could be solved with a single fix. The mileage issue was corrected by remapping the renamed and duplicated vehicle record back to the correct one and resyncing its mileage history, so miles driven started lining up with the actual routes being run again. Once that correction went through, revenue-per-mile across the three technicians normalized to a much more believable average of $14 per mile, calculated against July's real numbers: $35,308, $37,388, and roughly $34,000 in revenue across the team for the month.
The 200-hour week did not need a complicated fix so much as a cleaner rule. Days off needed to stop contributing a near-full day of phantom hours to the weekly total, which meant correcting how those entries were recorded and summed in the first place, so a day off reads as no hours worked rather than an accidental 23 hours and 59 minutes. It is a small technical correction with an outsized effect on trust: a manager who has seen one impossible number in a system stops believing any number in that system until it is proven clean, and that skepticism, while reasonable, makes the whole reporting layer less useful in the meantime.
The unpaid-invoice flag needed a different kind of fix entirely, one that was less about correcting bad data and more about building in a realistic expectation of how payments actually move. The company agreed to a new rule: an invoice only triggers a manager-contact flag if it is still unpaid three full days after the invoice date, rather than the moment it crosses the line. That small grace window absorbs the normal delay between a customer paying and that payment registering, without meaningfully delaying a manager's ability to catch a genuinely overdue account.
It is worth noticing that this fix did not involve loosening standards or letting more slip through unnoticed. A genuinely overdue invoice, one that is still unpaid well past the three-day window, triggers the flag exactly as before. What changed is that a normal, healthy payment cycle no longer gets treated as an emergency. That is the difference between a metric that measures a real problem and a metric that mostly measures the ordinary lag of how e-transfers get processed and recorded.
Profit sharing
made simple.
Give your team a stake in the company’s success. ShareWillow helps you create and manage profit-sharing programs that motivate employees and drive business results.
From noise to a number worth acting on
The clearest measure of whether this actually worked is the flag count itself. Before the three-day grace window went in, the system generated 19 manager-contact flags in a single month. After the fix, that number dropped to 4. Nineteen flags a month is not a management tool, it is background noise a manager learns to tune out, which defeats the entire purpose of having an automated alert in the first place. Four flags a month is something a manager can actually act on individually, follow up on, and trust.
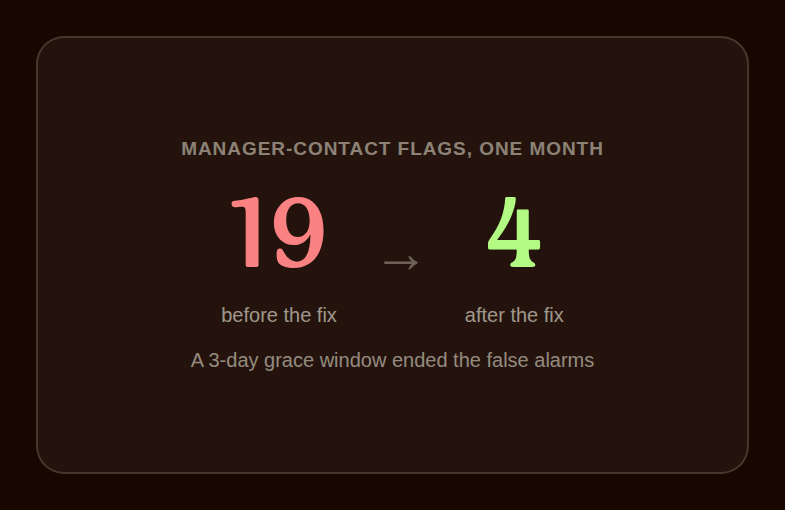
That drop from 19 to 4 is really the whole story in one number. It is the difference between a metric that technically exists and a metric that actually changes what a manager pays attention to. A flag that fires constantly for the wrong reasons trains people to ignore it, which means the one time it fires for a genuinely serious account, it gets the same shrug as every false alarm before it. Cutting the noise by nearly 80% did not just make the reporting cleaner. It restored the manager's ability to trust the alert enough to act on it the moment it appears.
The 200-hour week and the renamed vehicle record are worth remembering because of how ordinary they were. Neither problem involved anyone acting in bad faith or trying to game a number. A time-entry default, a vehicle renamed for a perfectly reasonable operational reason, and an alert threshold that never accounted for normal payment lag, three small, boring technical decisions, made independently and for unrelated reasons, that together corrupted three different metrics a manager was relying on to run the business. That is the ordinary way data integrity breaks down in a growing field service operation: not through one dramatic failure, but through several small, disconnected ones that each look harmless in isolation.
The practical takeaway for any route-based HVAC, plumbing, pest control, or utility service business is to treat an impossible number as a gift rather than an annoyance. A 200-hour week is so obviously wrong that it is easy to notice and easy to dismiss as a one-off glitch. The more valuable response is to ask what else that same broken mechanism might be quietly doing to other numbers nobody has scrutinized yet, the way this company's team traced one bad time entry into a mileage error and an over-firing invoice flag it had not even been looking for. ShareWillow's platform pulls directly from the job, time, and billing data a company already runs on, which means a data problem like this surfaces as a visibly wrong number instead of staying buried inside a spreadsheet formula nobody has opened in months.
Related reading
Conclusion
One impossible number is rarely an isolated glitch; treat it as a reason to check every metric built on the same pipeline.
Create incentives
that
drive results
You shouldn't need complex equity plans to align your team. ShareWillow makes it simple to create transparent profit-sharing programs that motivate employees and grow your business.

Incentive plans to help
small businesses thrive.
.png)
"I was able to leverage the knowledge of the ShareWillow team to learn how other companies were designing their bonus plans. The template was extremely helpful."

Brian Tustin
Owner, First Rate Movers
