
A commercial refrigeration and HVAC company covering three states couldn't explain a slowdown. Live performance tracking found the answer and paid out within a month.
When The Numbers Drop And Nobody Can Say Why
Multi-location service businesses run into a specific kind of frustration that single-shop owners rarely deal with. It's not that the numbers are bad. It's that when they dip, nobody can point to the reason fast enough to fix it.
That's exactly what happened to a commercial refrigeration and HVAC service company operating across three states. Production slipped for the better part of a month. Revenue was down, but not in a way that pointed to an obvious cause. No single branch had collapsed. No single technician had clearly checked out. The dip was spread thin enough across regions and crews that it hid from the monthly reports the leadership team was used to reading.
This is the quiet cost of lagging data. Most field service businesses, even ones running modern software like ServiceTitan, still make performance decisions off reports that summarize what happened weeks after it happened. By the time a manager notices average ticket size sliding or callback rates creeping up in one region, a month of underperformance has already happened, and whatever caused it may have already changed again.
For a company with technicians spread across three states, the problem compounds. A regional manager in one market can't see what's happening in another. Leadership sees a company-wide number that's down, but has no fast way to break it apart by technician, by branch, by job type, to find the actual thread to pull. Everyone agrees something changed. Nobody can say what.
The instinct in a lot of shops at this point is to wait it out, assume it's seasonal, or send an email reminding the team to "keep hustling." None of that fixes anything, because none of it identifies where the actual gap is. What this company needed wasn't more effort. It was visibility into exactly where the numbers were slipping, fast enough to still matter.
There's also a trust cost that builds up quietly during a stretch like this. When leadership can't explain a dip, the explanation techs hear tends to default to "the team needs to work harder," even when the real issue might be one branch running short-staffed, one job type taking longer than it used to, or seasonal demand shifting in a way nobody flagged. Technicians who are already performing well start to feel like they're being lumped in with a slowdown that has nothing to do with them, and that frustration adds up across three states faster than most owners realize.
Commercial refrigeration and HVAC service work is also less forgiving of guesswork than a lot of other trades. A slow month for a residential HVAC company might mean a few fewer replacements sold. A slow month for a commercial refrigeration operation can mean missed maintenance windows on equipment that, left unchecked, turns into an emergency call and an unhappy commercial account. The cost of not knowing where the slowdown is coming from isn't just lost revenue this month. It's risk stacking up in accounts the company can't afford to lose.
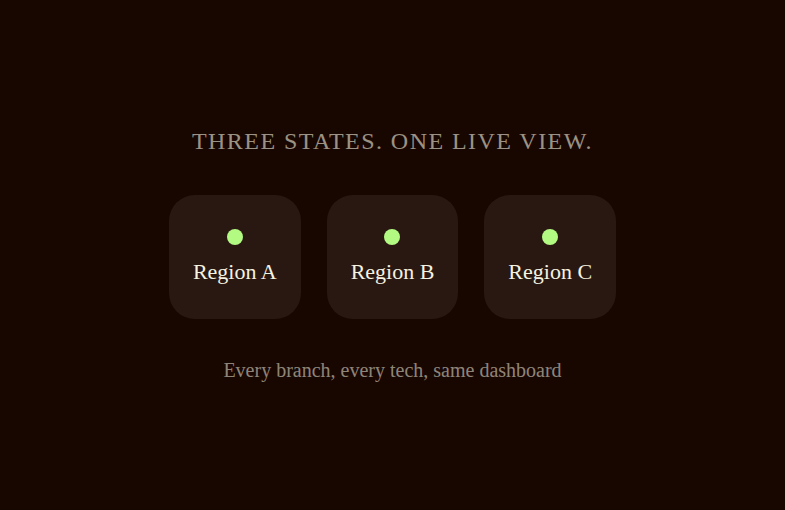
Putting Every Tech's Numbers On Live Display
Instead of waiting for next month's report to explain last month's dip, the company built a live tracking layer on top of the field service data it was already collecting, using ShareWillow's incentive platform to turn raw job history into numbers every technician and manager could see in real time.
Three metrics did most of the work:
- Revenue per technician, tracked continuously instead of totaled once a month, so a slow week shows up as a slow week, not as a buried line in next month's summary.
- Average ticket, broken out by tech and by branch, so a dip in one region can't hide inside a company-wide average.
- Callbacks per tech, surfaced immediately rather than discovered when a customer complaint reaches the office weeks later.
None of this required new hardware, a new field service platform, or months of setup. The data source was the software the company already ran every day. ShareWillow connected to it, organized it by technician and by branch, and made it visible on an ongoing basis instead of a monthly one. The company didn't need to change how techs did their jobs. It needed to change how fast leadership could see the jobs being done.
There's a second, quieter benefit that shows up once numbers go live: technicians start watching their own performance the same way leadership does. When a tech can see his own revenue and callback numbers updating in near real time, tied to what he actually earns, he doesn't need a manager to flag a slow week. He sees it himself, usually before anyone else does. That shifts a company culture from top-down correction to something closer to self-management, which matters even more when your crews are spread across three states and a regional manager physically can't be everywhere.
For a business this size, that shift alone changes how leadership spends its time. Instead of digging through monthly reports trying to reconstruct what happened, managers spend their time on the handful of technicians or branches the live data flags as actually needing attention.
It's worth being specific about what "no manual math" actually means here, because it's usually the part that kills these initiatives before they start. In a lot of shops, the idea of tracking performance by technician across three states sounds great until someone realizes it means a bookkeeper or ops manager pulling reports from multiple systems, matching them by hand, and rebuilding a spreadsheet every payroll cycle. That's not sustainable past a month or two, and it's exactly why so many performance tracking efforts quietly die after an enthusiastic launch. Automating the calculation, so the platform does the matching and the math instead of a person doing it between other responsibilities, is what let this company keep the system running past the first few weeks.
There's also a coaching benefit that's easy to underestimate. When a regional manager can pull up live numbers for every technician in their market, coaching conversations stop being vague. Instead of "we need to pick up the pace," a manager can point to a specific number, a callback rate that's crept up, an average ticket that's dropped on a specific job type, and have a conversation that's actually actionable. That's a very different kind of management than reacting to a company-wide dip nobody can explain.
Profit sharing
made simple.
Give your team a stake in the company’s success. ShareWillow helps you create and manage profit-sharing programs that motivate employees and drive business results.
From Mystery Slowdown To Payouts In Under A Month
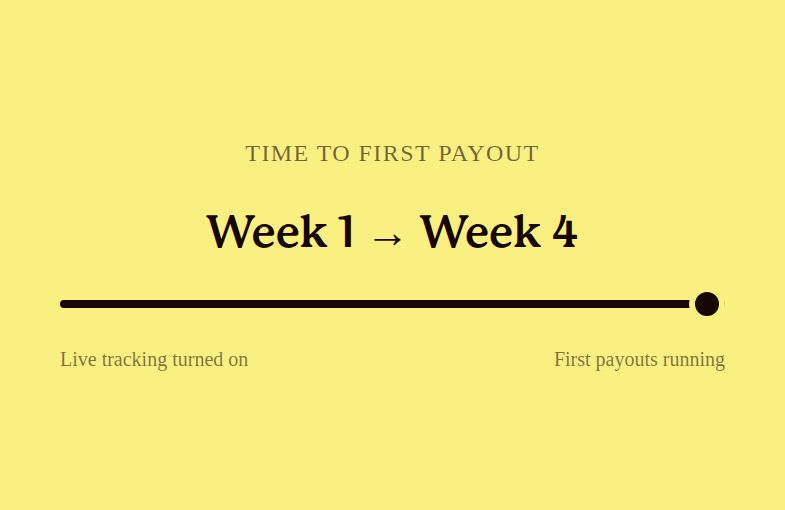
Here's what made the difference practical instead of theoretical: how fast it actually stood up. The company had its first performance payouts running by week four, calculated automatically off the live data, no manual spreadsheet reconciliation required to get technicians paid what they'd earned. And it did all of this without signing a long-term contract to find out if the approach would work for a business their size.
That speed matters more than it might seem to on paper. A lot of owners assume a real performance pay system, one tied to live job data across multiple locations, has to mean a drawn-out implementation: months of setup, a data team, a change management plan for the whole company. For this business, it meant weeks, because the underlying job data already existed. The work was organizing it and making it visible, not creating it from scratch.
It also meant the slowdown that started the whole conversation got solved along the way, not as a side project, but as the direct result of the visibility the company built. Once revenue, average ticket, and callbacks were tracked by technician in near real time instead of by month, the specific pockets driving the dip stopped hiding. A manager could see exactly which branch or which crew was pulling the company average down, instead of guessing at a company-wide number that told a flattened, misleading story.
There's a broader lesson here for any multi-location service business, refrigeration, HVAC, or otherwise. The gap between "something feels off" and "here's exactly what's off" is almost always a data visibility problem, not a work ethic problem. Techs in the field are usually doing their jobs. What's missing is a fast, clear line from the work they do to a number leadership can act on the same week, not the same quarter.
For facility managers running crews across multiple regions, this is worth sitting with for a second. If your only view into performance is a monthly rollup, you are, by definition, always looking at last month's problem. A live view doesn't just catch slowdowns faster. It catches them while there's still time to do something about the month you're actually in.
And for the technicians themselves, the payouts landing within weeks rather than a full sales cycle later did something a slower rollout couldn't have. It proved, quickly, that the new system wasn't just another initiative from corporate that would fade by next quarter. The numbers were live, the payouts were real, and they showed up fast enough for the connection between the two to actually register.
A short checklist for multi-location owners
If a slowdown at your own company has ever felt hard to pin down, a few questions are worth asking before you assume it's just a slow season:
- Can you see revenue, average ticket, and callbacks broken out by technician and by branch, today, without pulling and merging multiple reports?
- How many weeks old is the data leadership is actually making decisions from?
- If a specific branch or crew is underperforming, would you find out this week, or next month's report?
None of those questions require a new field service platform to answer. They require making the data you already have visible fast enough to act on. That's the entire difference between chasing last month's problem and catching this month's before it becomes one.
Related reading
Conclusion
If your reporting only tells you what happened last month, you're always solving last month's problem. A live view into revenue, average ticket, and callbacks by technician catches the slowdown while it's still happening, not after it's already cost you a quarter. See how ShareWillow turns the job data your team already generates into a performance system that pays out in weeks, not quarters, and check out how it's helped other HVAC and refrigeration service companies get the same visibility across every branch they run.
Create incentives
that
drive results
You shouldn't need complex equity plans to align your team. ShareWillow makes it simple to create transparent profit-sharing programs that motivate employees and grow your business.

Incentive plans to help
small businesses thrive.
.png)
"I was able to leverage the knowledge of the ShareWillow team to learn how other companies were designing their bonus plans. The template was extremely helpful."

Brian Tustin
Owner, First Rate Movers
