A water treatment and plumbing company only had an incentive plan for its technicians. ShareWillow built one scorecard covering the service manager, dispatch, CSRs, and the office too, and the first live month tracked $112,631 across three technicians alone.
For years, the incentive plan at this water treatment and plumbing company covered exactly one role: the technicians turning wrenches in the field. Everyone else, the service manager juggling callbacks, the dispatcher routing trucks, the CSRs answering the phone, the office manager closing out tasks, worked without a single dollar of their pay tied to how well the day actually went. The technician plan itself was not producing much either. Monthly award payouts had been running $150 to $400 a month, a number too small to feel like a real incentive and too inconsistent to plan around.
The company runs its field operations through ServiceTitan and tracks vehicle mileage through a separate fleet tool, and the more the team looked at the data behind that $150 to $400 range, the less it looked like a performance problem and the more it looked like a data problem. Senior technicians were not clocking in and out consistently, which meant their billable hours were being undercounted in exactly the metric meant to reward them. A newly hired technician's missing service history was being read by the reporting as a perfect 0 percent recall rate, a clean record that was actually just an absence of data dressed up as a win. VIP-pricing commission for the service manager was bundled into a single confusing line alongside several other manager metrics, making it hard for anyone to tell what was actually driving that number. And dispatch had no efficiency tracking at all, not a bad number, just nothing.
A Plan That Only Covered One Role Out Of Five
None of those problems were unique to this company. Most trades businesses build their first incentive plan around the technicians, because technician output is the easiest thing to point to and the role everyone assumes a bonus plan is for. The gap shows up later, once an owner notices that the person routing every truck of the day, or the CSR who has to talk an anxious customer through an emergency call, has no financial stake in whether that day goes well. Those roles shape outcomes just as much as the technician standing in front of the customer. They had just never been built into the plan.
The company's leadership had actually tried to account for some of this before, which is exactly why the VIP-pricing commission ended up bundled into a combined manager metric in the first place. The instinct to reward the service manager for more than just technician output was already there. What was missing was a clean way to separate a straightforward cash commission from a set of behavioral goals, so the two stopped blending into one number nobody could fully explain. That distinction, cash commission on one side and a weighted behavioral scorecard on the other, ended up being the actual fix, not a brand-new idea about who deserved to be paid for performance.
Building The Other Four Scorecards From Scratch
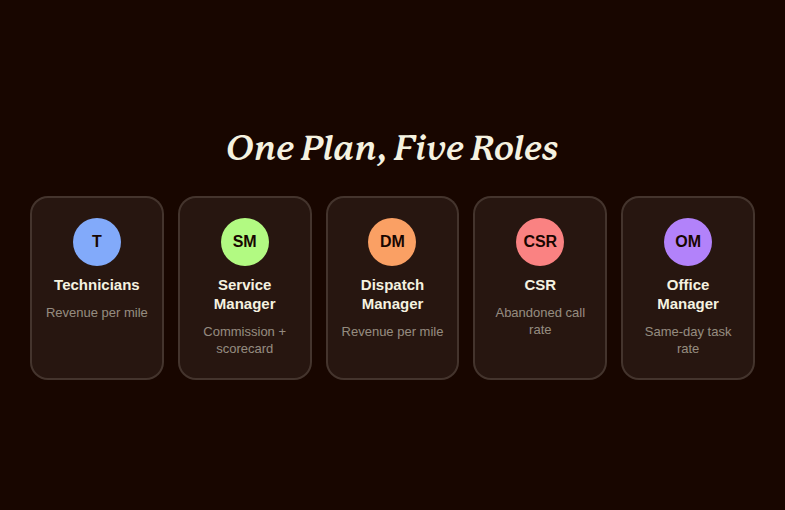
ShareWillow rebuilt the technician plan and then built four more from nothing. Technicians moved to a revenue-per-mile efficiency structure, pulling mileage from state mileage reports through the company's fleet tracking tool and filtering out install-only technicians whose jobs do not map cleanly onto a per-mile metric. The service manager's plan split into two pieces: a flat 10 percent cash commission on VIP pricing, kept separate this time instead of buried in a combined number, plus an independent 500-point weighted scorecard covering four specific behaviors, avoiding zero-dollar jobs, keeping recalls low, classifying callouts correctly, and responding to tasks quickly, weighted 25, 25, 40, and 5 percent respectively. The dispatch manager got a straightforward revenue-per-mile target of 20 or higher. CSRs were measured on abandoned-call rate, filtered to business hours so after-hours gaps would not unfairly count against them, plus how accurately they classified incoming calls. The office manager's metric was simpler still: the percentage of tasks closed within one business day. The full program went live August 1.
What Three Technicians Looked Like In The First Live Month
The first full review happened on August 13, two weeks into the new scorecards. The company's three core service technicians alone had generated $112,631 in tracked monthly revenue between them, individual numbers landing around $35,300, $37,400, and roughly $40,000. That is not a projection or a modeled estimate. It is what the ServiceTitan data showed once the reporting was actually built to catch it, which is worth sitting with for a moment: this was revenue the technicians were already producing. The scorecard did not create it. It made it visible and attributable in a way the old $150 to $400 payout structure never managed to do.
The revenue-per-mile number told a similar story, though it took one more fix to get there. Early in the rollout, a vehicle-mapping bug was distorting the mileage side of the calculation, pairing revenue with the wrong vehicle's mileage in a handful of cases and throwing off the ratio. Once that mapping was corrected, revenue per mile settled at a clean $14 average across the technician group, a number the office could finally trust enough to build a dispatch target on top of.
A Bug Fix That Looked Like A Trust Problem
The second number worth telling straight is the one that is easiest to oversell. A manager-accountability metric tracking unpaid-invoice follow-up had been flagging 19 issues in a single week for one person. After a reporting-logic fix, that same metric showed only 4 for the entire month. It would be tempting to describe that as the office manager getting four times better at chasing down unpaid invoices in a matter of weeks. That is not what happened, and this piece is not going to claim otherwise. The improvement traces back to a fix in how the metric itself was being calculated, not a sudden change in how anyone was working.
That distinction matters more than it might seem. A metric that was over-flagging issues by roughly 4 to 5 times was not just noisy, it was actively eroding trust in the whole scorecard. If the office manager's dashboard was telling her she had 19 unresolved problems when the real number was closer to 4, either she starts ignoring the metric entirely, reasonably, since it clearly does not reflect reality, or she burns hours a week chasing phantom issues that were never really there. Fixing the calculation did not manufacture a performance win. It repaired the one thing every metric in a scorecard like this actually needs to survive: a manager's willingness to trust the number enough to act on it.
The CSR and dispatch numbers did not get the same two-week spotlight the technicians did, and that is worth saying plainly rather than papering over. Abandoned-call rate and correct-classification data take longer to stabilize than a technician's revenue, since call volume swings day to day in a way that a completed job does not. The dispatch manager's revenue-per-mile target of 20 or higher is still being measured against the same freshly corrected mileage data the technicians benefited from, which means its first real reading was only just becoming reliable by the time of this review. Those two roles are the ones this company is watching most closely over the coming weeks, precisely because their numbers take longer to earn the same trust the technician and manager scorecards already have.
Profit sharing
made simple.
Give your team a stake in the company’s success. ShareWillow helps you create and manage profit-sharing programs that motivate employees and drive business results.
Why One Scorecard For Five Roles Is Harder Than It Sounds
Building an incentive plan for a single role is relatively contained. The metrics live in one place, the comparisons are apples to apples, and everyone being measured understands the game in roughly the same terms. Building five interlocking plans for five different roles, on top of one shared ServiceTitan account and one fleet mileage tool, is a different kind of problem. A technician's revenue-per-mile metric and a dispatcher's revenue-per-mile target have to be defined consistently even though the two roles touch the data differently. A service manager's scorecard has to separate a clean commission line from a behavioral scorecard so the two do not blur into one confusing number the way the old VIP-pricing metric did. None of that complexity is visible from the outside. It shows up as a list of quiet decisions: which technicians to exclude from a mileage metric, how to weight four different manager behaviors against each other, where to filter a CSR's call data so an overnight gap does not get punished as a missed call.
That last example is a small design choice with an outsized effect on whether a CSR trusts the plan at all. A water treatment and plumbing company does not run a 24-hour call center, so any call that comes in outside business hours and goes unanswered is not really a CSR performance issue, it is a staffing reality. Counting those calls against the abandoned-call metric would have punished CSRs for hours nobody was scheduled to work, and it would have taken exactly one bad pay period for the team to stop believing the number meant anything. Filtering the metric to business hours only was a small technical decision, but it is the kind of decision that determines whether a scorecard earns trust or loses it in its first month.
It is also worth being clear about what two weeks of data can and cannot tell an owner. $112,631 across three technicians in the first live month is a real, verified number, not a projection, and a clean $14-per-mile average after fixing a mapping bug is a real improvement in data quality. Neither of those is the same as proof that total revenue went up because of the new scorecards. What changed, provably, is that revenue the technicians were already generating became visible, attributable, and tied to pay across all five roles instead of just one. Whether that visibility compounds into more revenue over a full quarter is the next question this company is watching for, not one this first month can answer on its own.
Where This Goes From Here
The company is now tracking a full quarter of data across all five scorecards, watching whether the $14-per-mile average holds as more technicians clock in and out consistently, and whether the manager scorecard's other three behaviors settle into numbers as clean as the invoice metric became after its fix. The bigger shift already happened. A shop that used to have an incentive plan for one role out of five now has one for all five, built on top of the same ServiceTitan and mileage data that was sitting there all along, waiting to be measured correctly. Field service companies wrestling with the same problem, a plan that only reaches the technicians while dispatch, CSRs, and the office go unmeasured, can see how ShareWillow structures multi-role plans on the product features page, or look at what a plumbing-specific incentive plan typically covers. Shops unsure whether their own technician thresholds are quietly excluding part of the crew, a related but distinct problem, can read how one home services company found and fixed that exact issue, or start with a free incentive plan audit of their own.
Related reading
Conclusion
After building one scorecard that finally covered five different roles instead of just technicians, this water treatment and plumbing company tracked $112,631 in technician revenue and a clean $14-per-mile efficiency number in its first live month.
Create incentives
that
drive results
You shouldn't need complex equity plans to align your team. ShareWillow makes it simple to create transparent profit-sharing programs that motivate employees and grow your business.

Incentive plans to help
small businesses thrive.
.png)
"I was able to leverage the knowledge of the ShareWillow team to learn how other companies were designing their bonus plans. The template was extremely helpful."

Brian Tustin
Owner, First Rate Movers