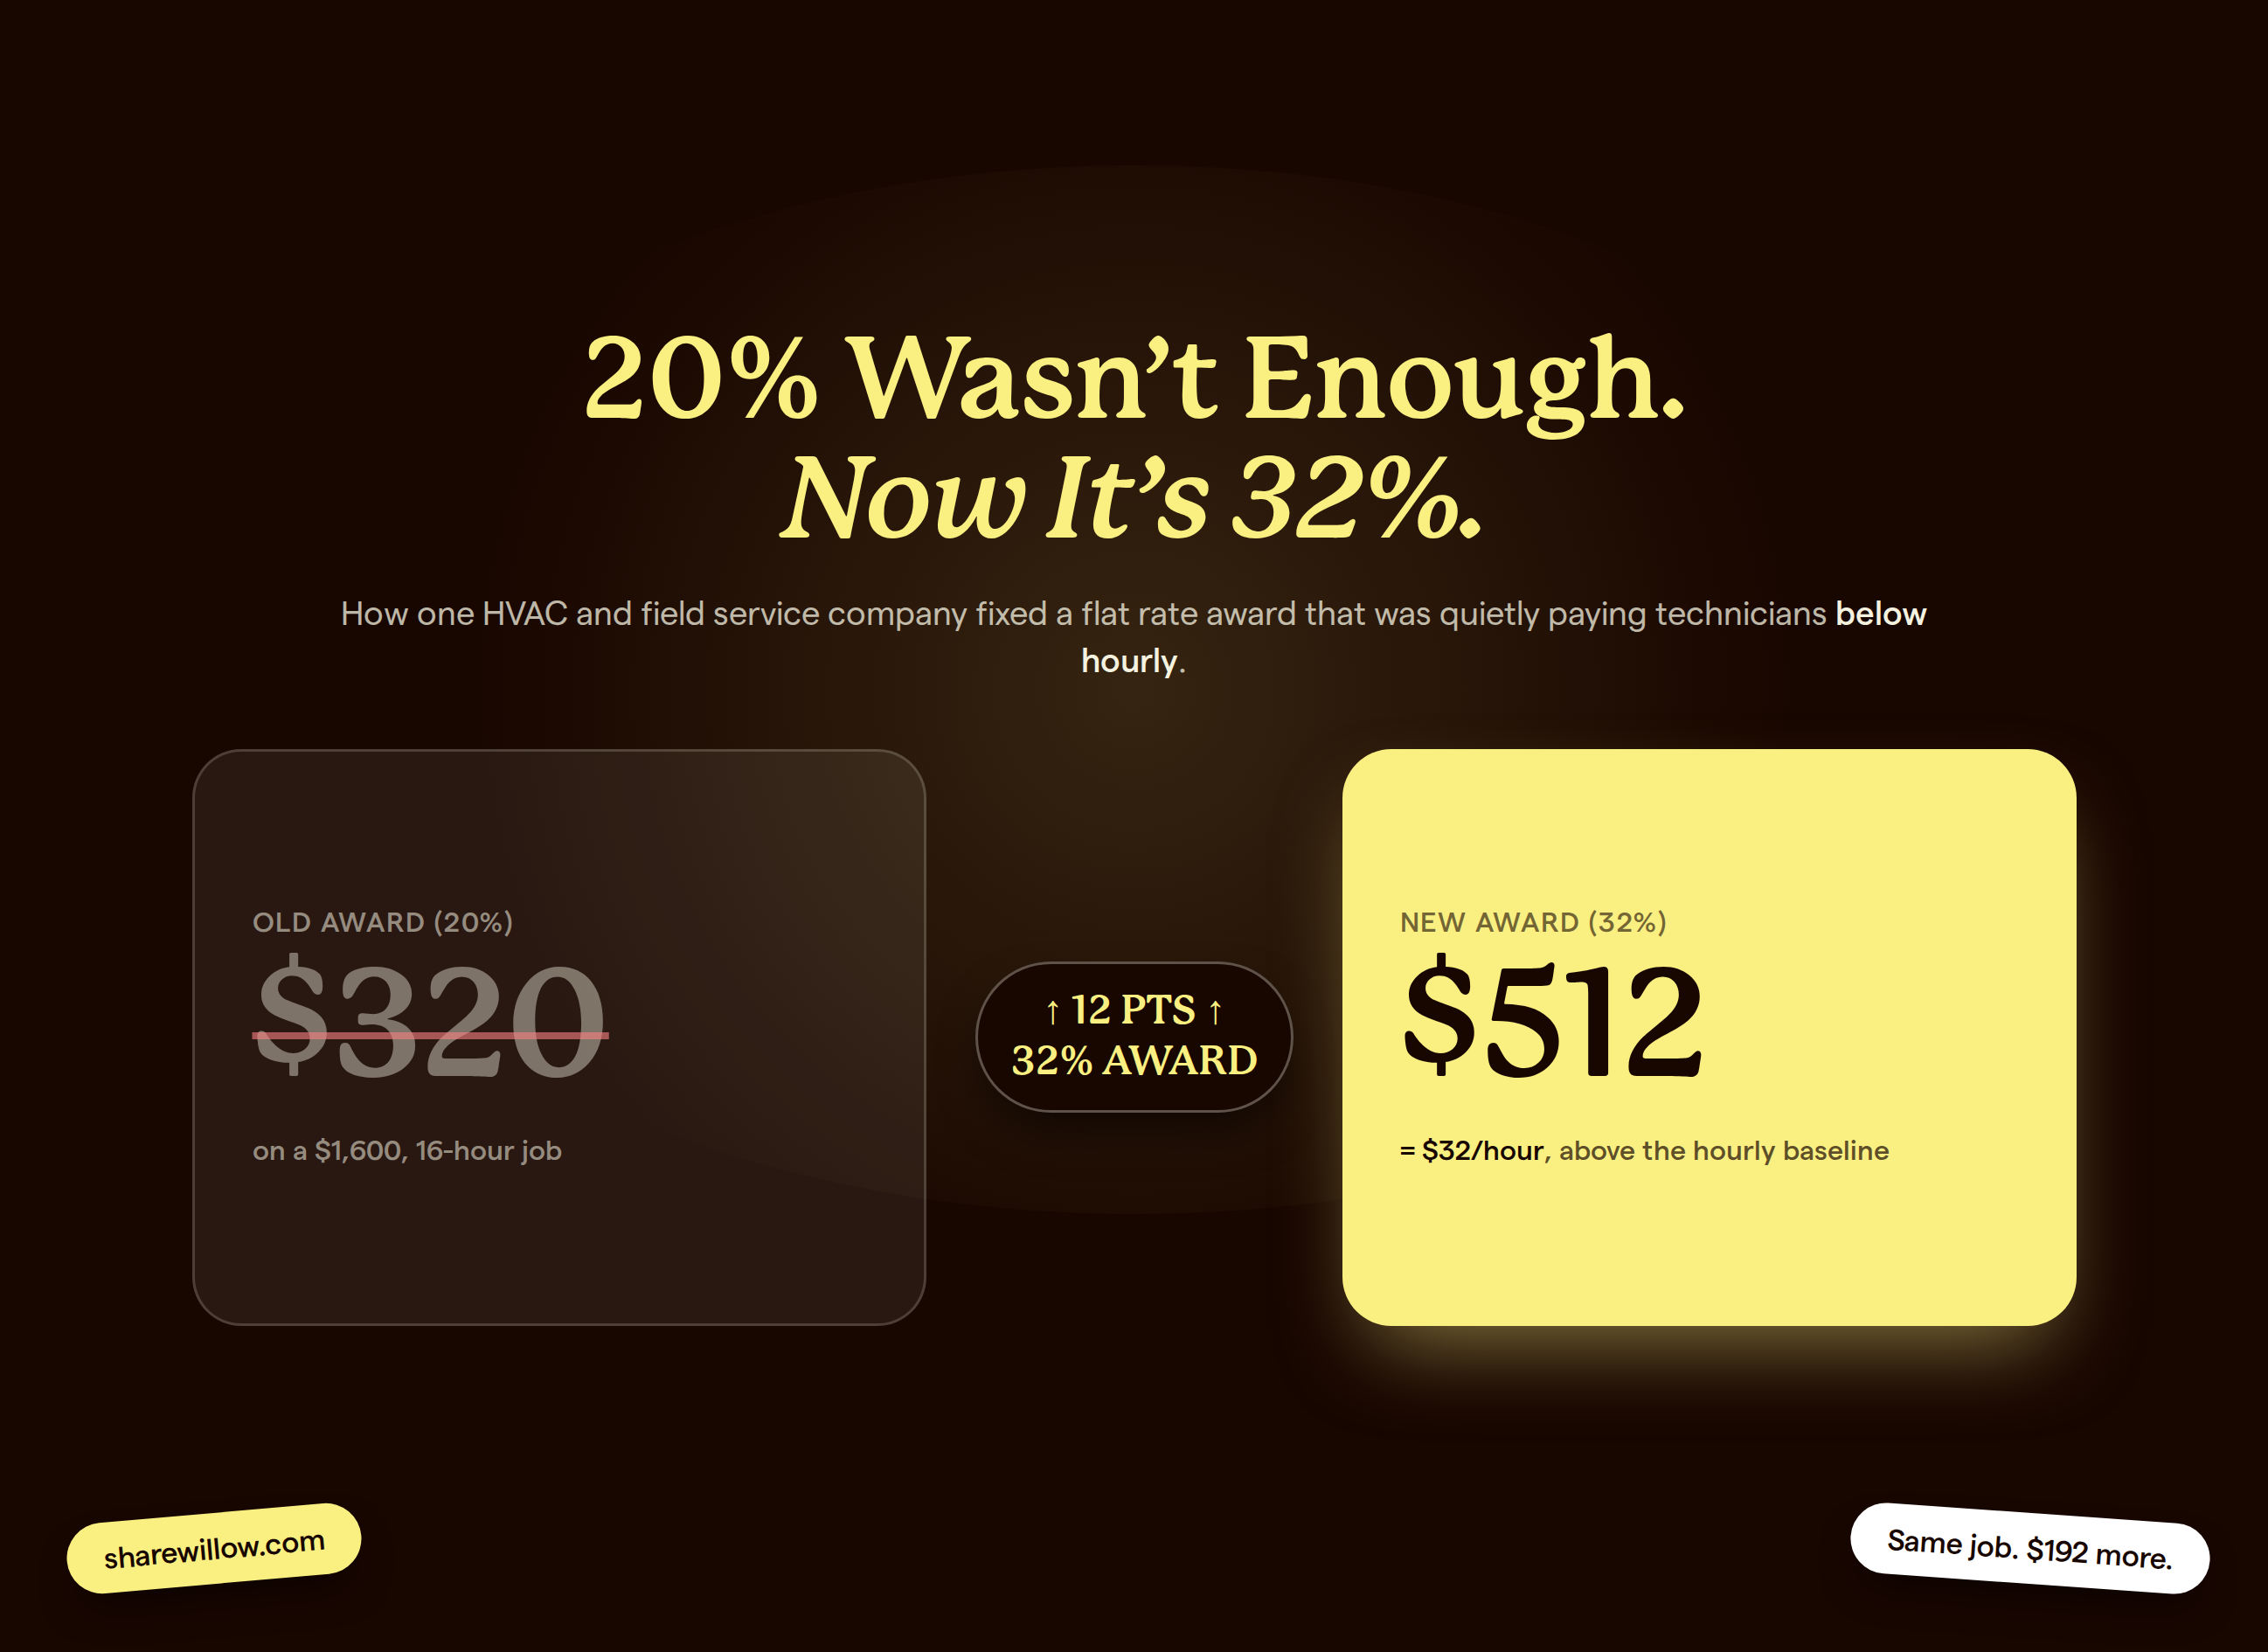
A large HVAC company was paying $30,000 a year for a TV leaderboard tool, then reverted to manual spreadsheets. Building a real KPI dashboard before launching a new incentive plan caught tracking errors nobody knew were there.
The Tool Got Cut. The Problem Didn't.
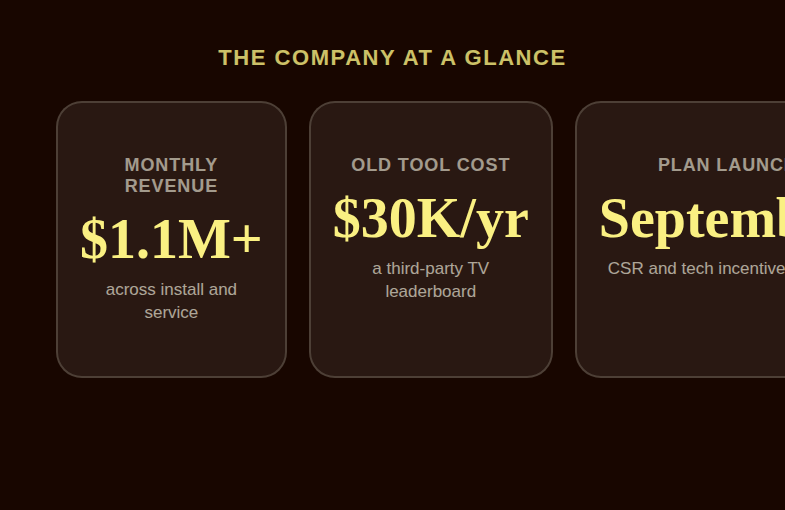
Most shops don't set out to track performance badly. It usually happens gradually: a tool that used to work stops being worth the cost, gets cut, and nothing quite replaces it. That's roughly the story at a large HVAC company doing more than $1.1 million a month in revenue across install and service work. For a while, the company paid a third-party vendor around $30,000 a year for a TV leaderboard tool that displayed team performance visually around the office: booking rates, job counts, the usual scoreboard stuff meant to keep a team's attention on the numbers that mattered.
Quick facts
- HVAC company doing $1.1M+ in monthly revenue, multi-person CSR and technician team
- Previously paid roughly $30,000/year for a third-party TV leaderboard tool
- After cutting it, performance tracking reverted to manually maintained spreadsheets
- New KPI dashboard pulls live data directly from the company's field service system
- Incentive plans built on the new dashboard are scheduled to launch in September
Eventually the cost stopped making sense and the tool got cut. What replaced it wasn't a better system. It was a set of spreadsheets, updated by hand, tracking booking rate per CSR, scheduled tune-up counts, install job revenue, and a billable-efficiency number that accounts for how many hours a crew actually has available. All useful metrics. All scattered, all manually entered, and all only as accurate as whoever last updated the sheet remembered to be.
That's a familiar arc for a lot of growing shops: pay for visibility, decide it's not worth the price tag, and quietly accept less visibility as the tradeoff. It works right up until the numbers you're making decisions on turn out to be wrong, and nobody notices because there's no live source of truth to check them against.
Building The Dashboard Surfaced The Real Problem
The company brought ShareWillow in to build a live KPI dashboard pulling directly from its field service system, with a TV-mode view planned to eventually replace the old leaderboard tool entirely, and CSR and technician incentive plans layered on top once the numbers were solid. That last part, once the numbers were solid, turned out to matter more than anyone expected going in.
Wiring up live metrics means someone has to trace each number back to its source, and that process caught real errors that had been sitting in the company's reporting for who knows how long. One CSR's tracked tune-up count for the month corrected from a reported 6 up to somewhere between 43 and 46, once the job-type logic behind the count was actually fixed. Install job revenue, which had been showing as effectively $0 in the existing reports, corrected to roughly $280,000 month-to-date once it was properly captured.
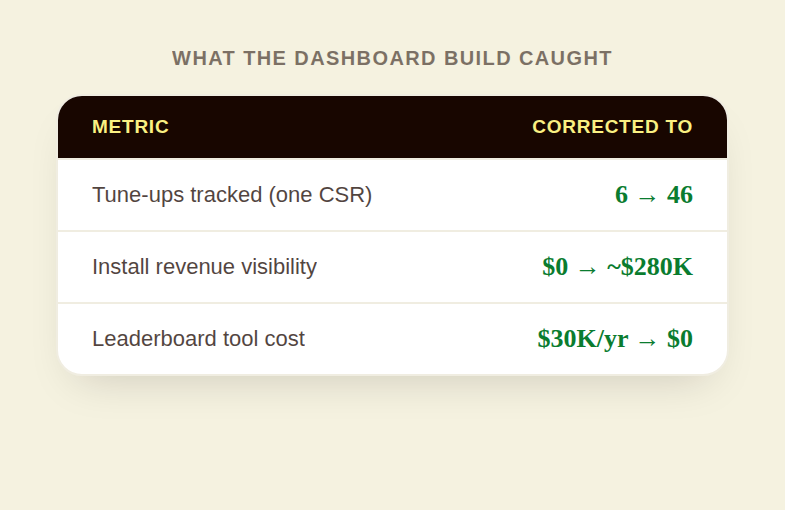
Those aren't rounding errors. A CSR whose real contribution is 40-plus tune-ups a month, showing up in the numbers as 6, isn't just invisible. They're actively being under-credited for work they're already doing, on a report an owner might be using to decide who's pulling their weight. And $280,000 in install revenue that isn't showing up anywhere means every downstream decision, staffing, commission, even basic cash flow forecasting, is being made against numbers that are quietly, substantially wrong.
Why This Had To Happen Before The Incentive Plan, Not After
It's tempting to build the exciting part first: design the commission structure, set the bonus rates, launch the plan, and fix data issues as they surface. This company's build went the other direction on purpose. CSR and technician incentive plans are scheduled to go live in September, after the dashboard's numbers have been checked against reality rather than before.
That order matters more than it sounds like. An incentive plan built on top of a tune-up count that's undercounting by a factor of seven doesn't just produce a slightly-off bonus. It produces a bonus that actively punishes the people doing the most work, because the system paying them can't see most of what they did. Catching that kind of error during the dashboard build, months before real money is riding on the number, is a far cheaper place to find it than after the first incentive payout goes out wrong.
Profit sharing
made simple.
Give your team a stake in the company’s success. ShareWillow helps you create and manage profit-sharing programs that motivate employees and drive business results.
The Outcome, So Far
It's worth being direct about where this account actually stands: the incentive plan itself hasn't launched yet, so there's no bonus payout number to report as a win. What's already measurable is the accuracy fix and the cost the company no longer carries. The $30,000-a-year leaderboard tool is gone, on its way to being replaced by a dashboard the company already owns as part of its ShareWillow build. And the tracking errors it caught, the sixfold undercount on tune-ups, the six-figure gap in install revenue visibility, are corrected before a single incentive dollar depends on them being right.
That's a different kind of result than a dollar figure on a bonus check, but for a shop this size, it might matter more. A KPI dashboard that catches its own errors before they cost anyone money is doing exactly what a $30,000-a-year tool never did: making the numbers something the owner can actually trust, not just something that looks good on a TV in the break room.
What To Check Before You Build An Incentive Plan On Top Of Your Data
- Pull one technician or CSR's numbers for last month and trace them back to the original job records by hand. Do they match?
- If your performance tracking still lives in a spreadsheet, ask who's updating it, how often, and what happens when they're out sick or on vacation.
- Before attaching real pay to a metric, confirm the metric itself has been checked against source data at least once, not just assumed to be right because it's always been reported that way.
A dashboard is only as trustworthy as the plumbing underneath it. If you're weighing whether to build performance tracking before or after an incentive plan, this is the argument for before: catching a data error costs you an afternoon of reconciliation work. Catching it after techs have been underpaid for months costs you their trust, and that's much harder to rebuild than a spreadsheet. Take a look at ShareWillow's KPI and scorecard features to see how a live dashboard like this one gets built, or read how a family-owned plumbing company finally got a KPI scorecard that works for a similar build in a different trade.
Related reading
Conclusion
Before you build pay on top of a number, check the number. A dashboard that catches its own errors is worth more than one that just looks good on a TV in the shop.
Create incentives
that
drive results
You shouldn't need complex equity plans to align your team. ShareWillow makes it simple to create transparent profit-sharing programs that motivate employees and grow your business.

Incentive plans to help
small businesses thrive.
.png)
"I was able to leverage the knowledge of the ShareWillow team to learn how other companies were designing their bonus plans. The template was extremely helpful."

Brian Tustin
Owner, First Rate Movers