
A 12-person plumbing, HVAC, and electrical company ran real job history through ShareWillow to see what incentive pay could add on top of base wages. One technician's effective hourly rate rose from $32 to $60.64, on the exact same jobs already on the books.
Flat Pay Hides What a Crew Is Actually Worth
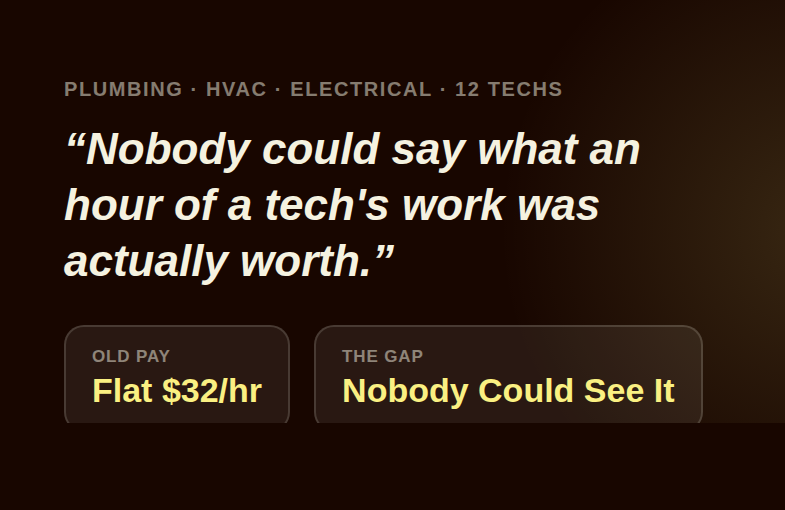
A 12-person plumbing, HVAC, and electrical company had a version of a problem most trade businesses eventually run into. Every technician was paid a flat hourly rate, $32 an hour, regardless of how much revenue a given job actually produced. A tech who closed a $4,000 install and a tech who spent the same afternoon on a $400 service call took home the same paycheck. Leadership suspected that flat structure was quietly costing them their best people, but nobody could say by how much, because nobody had ever run the numbers.
That is a strange position for a data-driven industry to be in. HVAC and plumbing companies track callback rates, first-time fix percentages, and average ticket size obsessively. Yet when it came to the one number that mattered most to a technician walking to their truck at the end of the day, what an hour of their work was actually worth, most shops were still guessing. Flat pay is administratively simple. It is also, once a company has enough job history to look closely, almost never fair.
Nobody could say what an hour of a tech's work was actually worth. They just knew $32 wasn't the real number.
The company had heard the pitch before: add commission, add spiffs, add some kind of incentive on top of base pay. What stopped them was not doubt about the idea. It was not knowing what the real number would look like. Promise too little and a skeptical crew shrugs it off as a gimmick. Promise too much and a business owner is staring down a payroll number they cannot sustain. Guessing in either direction is how good incentive plans die before they ever launch.
So instead of guessing, they did something simpler and more useful. They pulled real, already-completed job history, actual jobs, actual revenue, actual hours on site, and ran it through ShareWillow to see exactly what an incentive layer would have paid out on work the crew had already done. No hypothetical scenarios, no rounded estimates. Just the company's own numbers, run against a real compensation model, before a single dollar of anyone's actual pay changed.
Modeling the Real Number Before Changing a Single Paycheck
The mechanics here matter more than they might seem at first glance. This was not a projection built on averages or industry benchmarks. It was the company's own closed jobs, the same technicians, the same customers, the same trucks, run through a real incentive structure to see what the math actually produced.
Keeping the Base, Adding a Real Layer On Top
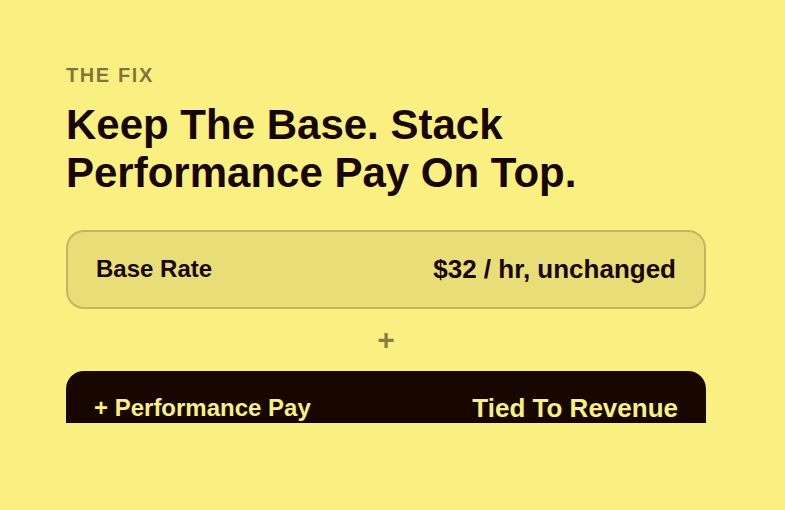
The base rate stayed untouched. Nobody's guaranteed $32 an hour was ever at risk, which matters more than it sounds like it should. A crew that has only ever known flat pay is naturally suspicious of any plan that could be read as a pay cut wearing a new name. Protecting the base and building the incentive as something added on top, not something carved out of what people already had, is what makes a plan like this survivable in the first ninety days, long before anyone has a full year of payouts to point to as proof.
On top of that base, a performance layer was modeled against real production: revenue generated per job, tied to the technician who actually did the work. The goal was not to reward activity for its own sake. It was to connect pay to the value a technician actually created on site, the install closed, the repair completed, the upsell the customer said yes to because the tech took the time to explain it.
Why Real Job Data Beats a Hypothetical Every Time
Running this against real history instead of a hypothetical changed the conversation entirely. Instead of telling a tech "this plan should earn you more," leadership could point to a specific week, a specific set of jobs already completed, and show exactly what that plan would have paid. That is a fundamentally different kind of proof than a spreadsheet full of assumptions about job mix and close rates that may or may not hold up once the plan actually launches.
It also protected the business side of the equation. Before committing to a structure, ownership could see the full payroll impact across the whole crew, not just the standout performer. A plan that looks great for one technician and unsustainable across twelve is not a plan worth launching. Modeling against real, already-completed jobs let them see both sides of that at once: what the best-performing tech stood to gain, and what the plan would cost the business if every technician on the roster hit similar numbers.
This is the piece a lot of shops skip when they build HVAC and plumbing incentive plans on instinct instead of evidence. A commission rate that feels generous in a conference room can look very different once it is run against five, ten, or twelve real technicians and a full month of real jobs. Testing the number against actual history, before it ever touches a paycheck, is what turns a plan from a guess into something a business can stand behind.
Profit sharing
made simple.
Give your team a stake in the company’s success. ShareWillow helps you create and manage profit-sharing programs that motivate employees and drive business results.
The Result: $32 an Hour Became $60.64, on the Same Work
Here is the number that made the exercise worth running. For one technician, on real, already-completed jobs, the effective hourly rate went from a flat $32 to $60.64 once the modeled performance layer was applied. That is an increase of roughly 89%, not on hypothetical future jobs, but on work that technician had already done, for customers who had already paid, in weeks that had already closed out on the books.
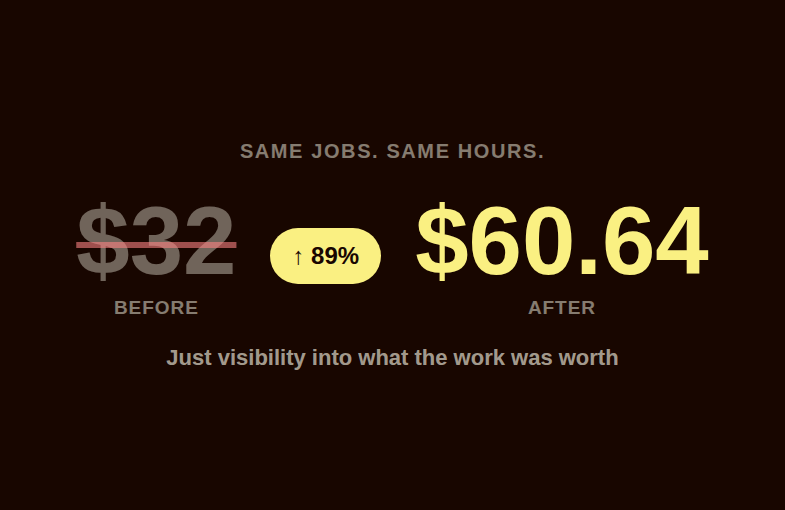
Same jobs. Same hours. Same technician, doing the same work they had always done. The only thing that changed was whether the business had a way to see, and pay for, what that work was actually worth. That is the part worth sitting with. This was not a case of a technician being asked to work harder, faster, or longer to earn more. The value was already there in the jobs on the books. Flat pay had simply never been able to see it.
It is worth being precise about what this number represents and what it does not. This is one technician's result, modeled against real history, not a company-wide average or a permanent guarantee for every person on the crew. Different technicians, with different job mixes and different production levels, will land in different places under the same structure. That is not a flaw in the model. It is the entire point of moving away from flat pay in the first place: a plan that pays based on real production will always show more spread between technicians than a plan that pays everyone the same number regardless of what they produced.
What This Means for Your Crew
- Flat pay hides your best performers as effectively as it hides your worst ones. If every technician takes home the same hourly rate regardless of production, you have no way of knowing how much value your top people are actually generating, or how much you might be at risk of losing them to a shop that pays closer to what they are worth.
- Model against real, closed jobs before you change a single paycheck. A hypothetical projection is a guess dressed up as a plan. Running an incentive structure against your own job history turns that guess into evidence, for you and for your crew.
- Protect the base rate when you introduce a performance layer. Adding to what a technician already earns is a very different conversation than restructuring their pay from scratch, and it is a large part of why a new plan gets trusted instead of resisted.
- Check the plan against your whole roster, not just your top performer. A structure that looks great for one technician has to also make sense for the other eleven, or it will not survive contact with a real payroll cycle.
- The value was already in the jobs. The plan just had to catch up to it. In a lot of shops, the revenue to support better pay already exists in the numbers on the books. The gap is visibility, not volume.
You do not need to run a twelve-person plumbing, HVAC, and electrical company to have some version of this gap. Any HVAC or field service business sitting on a full history of closed jobs is also sitting on the answer to what a real incentive plan should look like. It just has to actually run the numbers to find it. For a look at how one multi-trade HVAC company closed a similar pay gap, see how a $100,000 revenue month turned into a $3,000 commission problem worth solving.
Related reading
- Same Bonus, Any Callback Rate: How an HVAC Company Tied Pay to a 3% Quality Bar
- Techs Bring Leads. Now They Get Paid: How an HVAC Company Automated Its $500 Referral Bonus
- HVAC Technician Incentives to Motivate Your Team
- 9 Bonus Structure Examples Employees and Employers Love
- HVAC Flat Rate Pay Plan: How a Multi-State Field Service Company Fixed a Formula That Paid Techs Below Hourly
Conclusion
If your crew is still paid flat while the job data says otherwise, that gap is usually fixable without guessing. ShareWillow models incentive pay against your own closed-job history before it touches a single paycheck, so you know the real number before you promise it. Reach out to see what your crew's data actually shows.
Create incentives
that
drive results
You shouldn't need complex equity plans to align your team. ShareWillow makes it simple to create transparent profit-sharing programs that motivate employees and grow your business.

Incentive plans to help
small businesses thrive.
.png)
"I was able to leverage the knowledge of the ShareWillow team to learn how other companies were designing their bonus plans. The template was extremely helpful."

Brian Tustin
Owner, First Rate Movers
