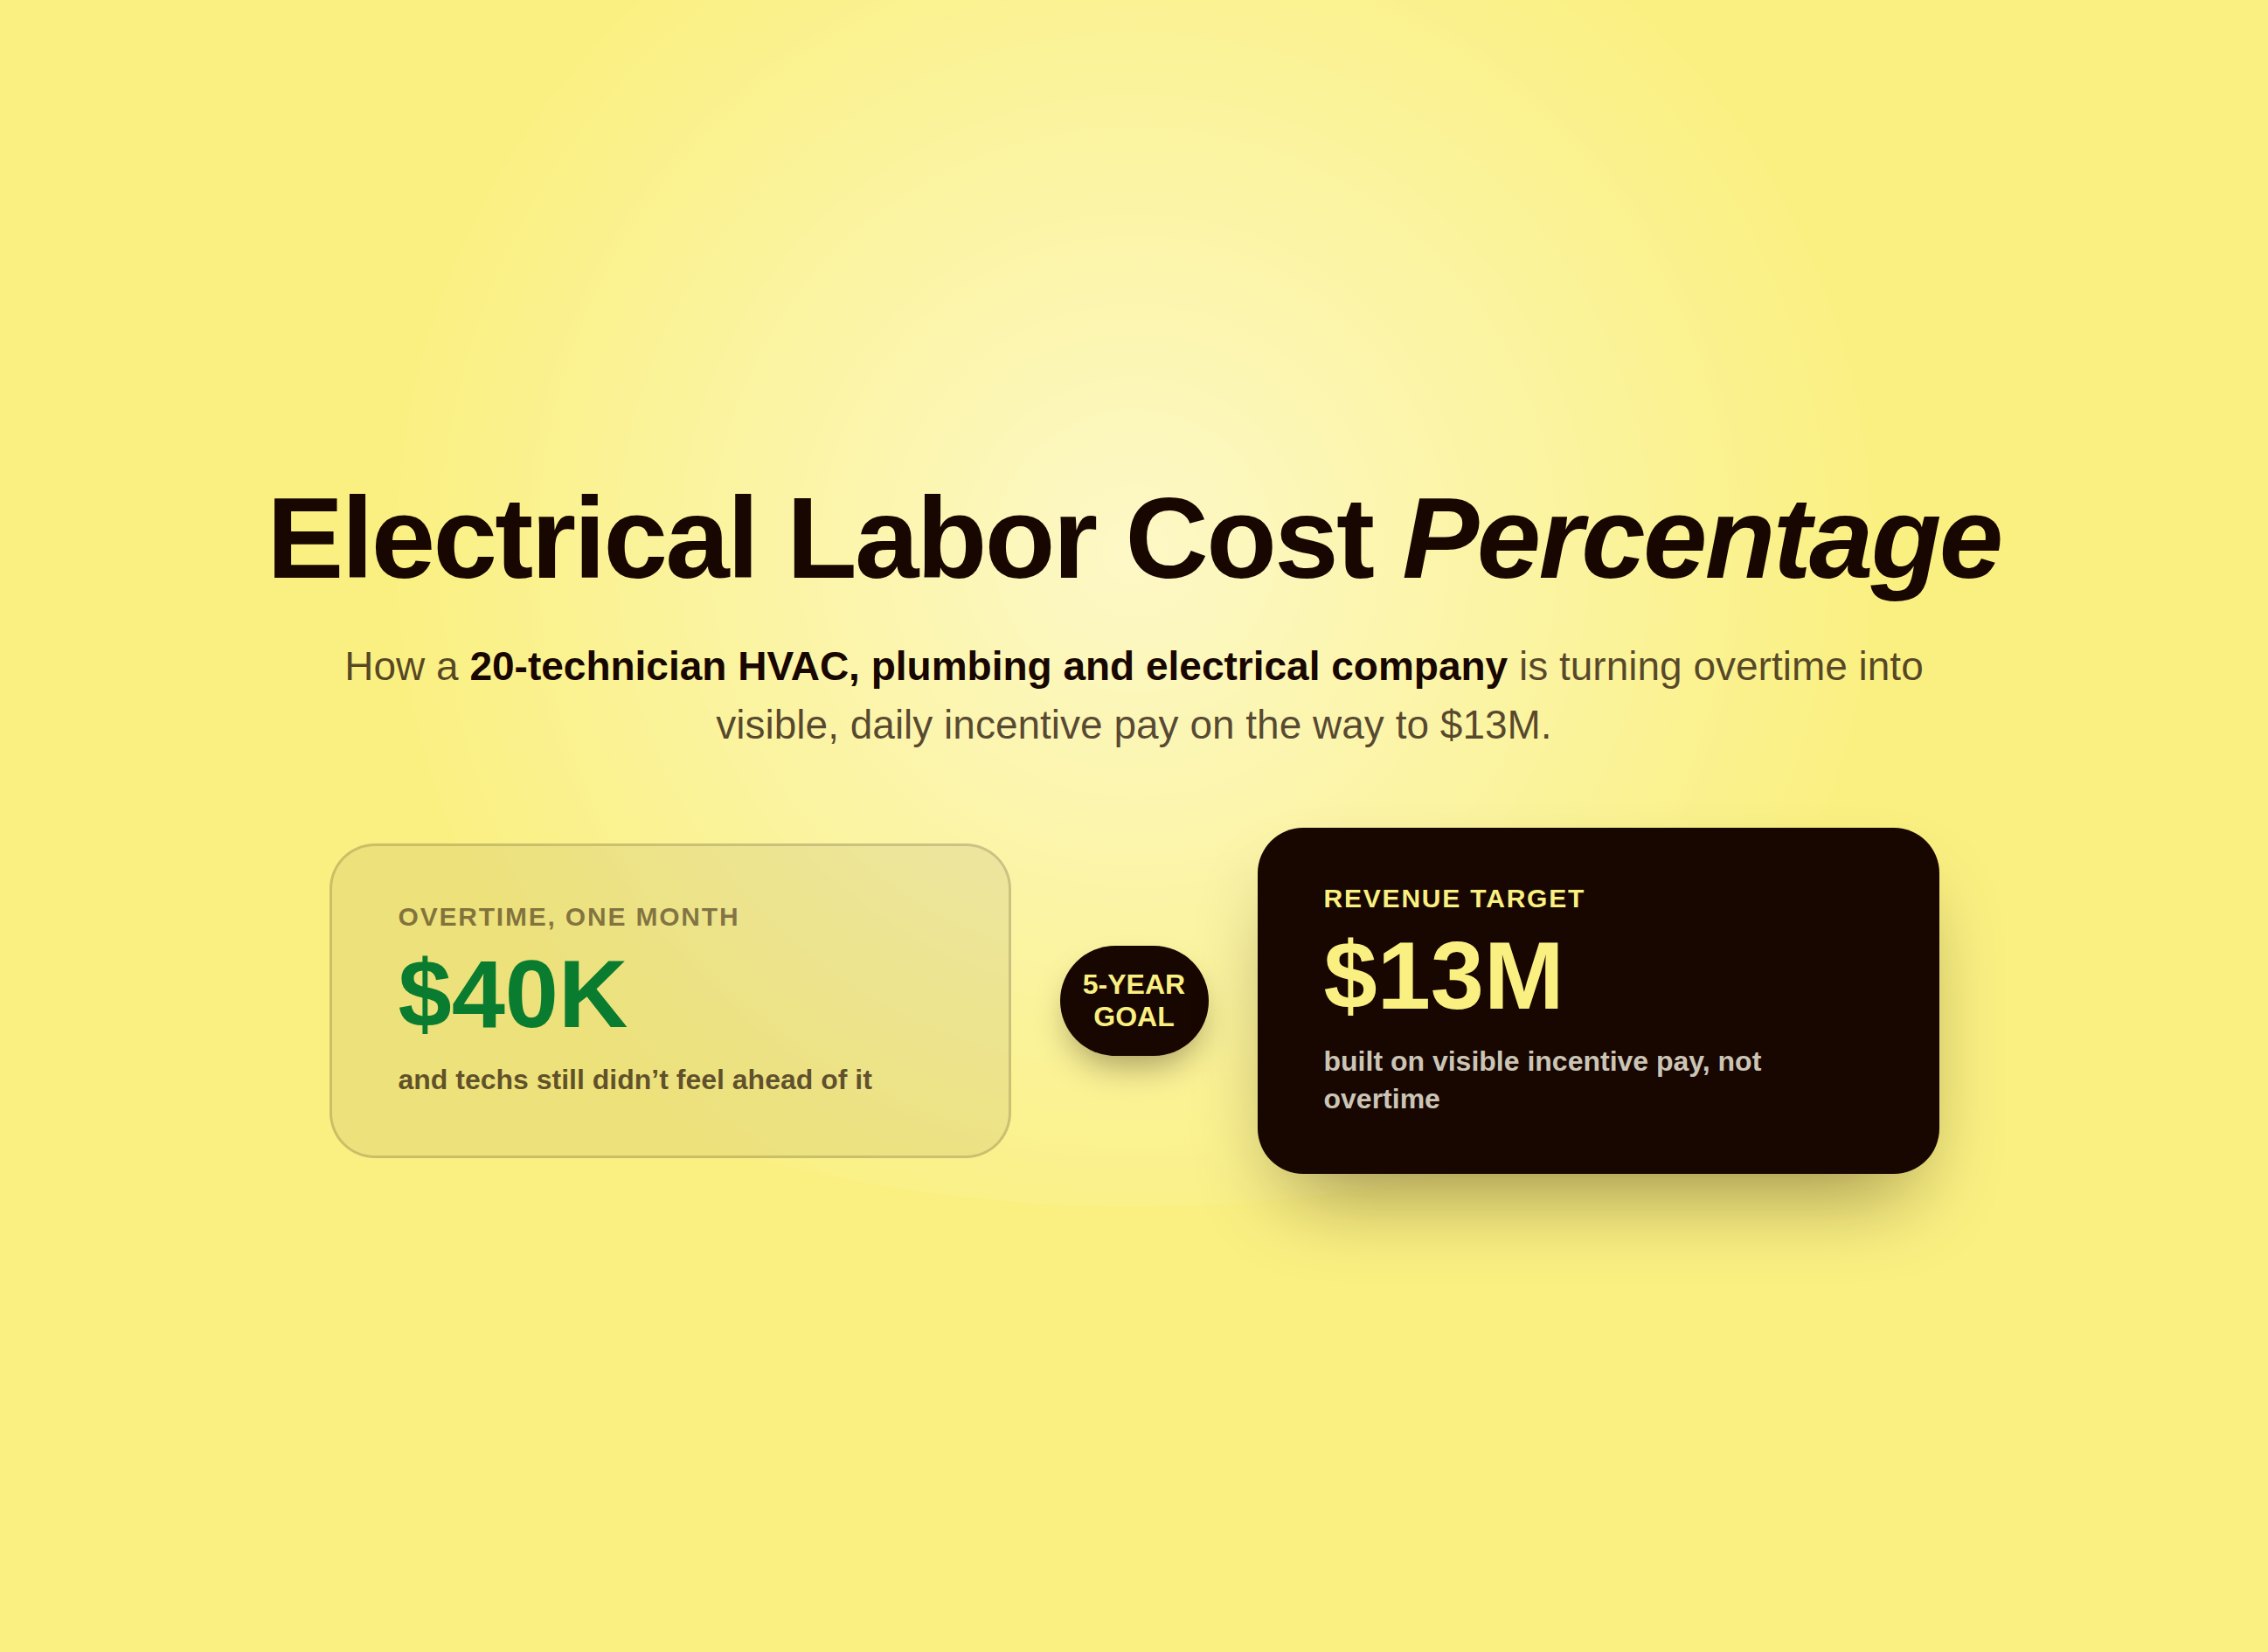
A residential HVAC company tracked technician bonus standings in a Google Sheet that someone had to update by hand, and financed jobs could push a payout back three or four days before anyone noticed. Here is what changed once the numbers started running themselves.
For a lot of residential HVAC companies, the incentive plan itself is not actually the hard part. Deciding what to pay technicians for, and how much, is a conversation an owner can usually work through in an afternoon. The hard part is everything downstream of that decision: keeping the numbers accurate, keeping them current, and making sure technicians can actually see where they stand without having to ask someone in the office. One residential HVAC company, running plans across service technicians, an install team, and a membership and review spiff program, was solving that second problem with a Google Sheet, and the Google Sheet was losing.
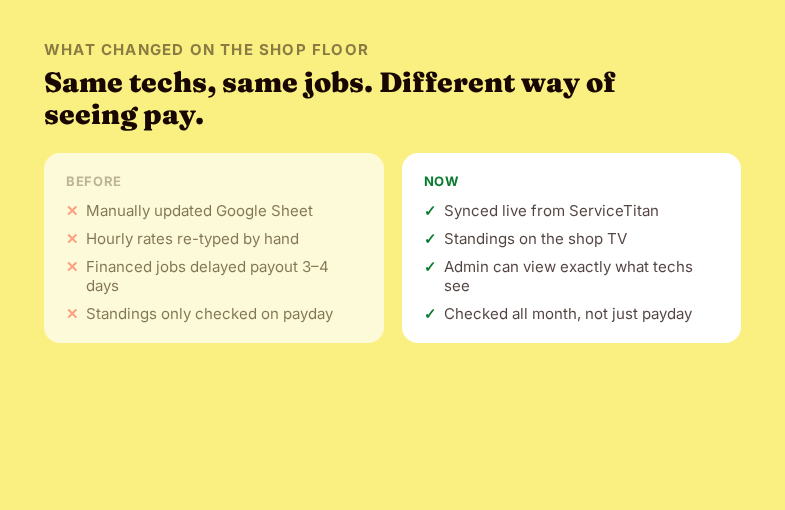
Every update to that sheet was manual. Hourly rates had to be re-entered by hand whenever they changed instead of pulling automatically from payroll. Standings only really got checked once, on payday, because that was the one moment the numbers were guaranteed to be current enough to trust. And financed jobs, which make up a real share of residential HVAC install work, created their own quiet problem: because financing adds a processing delay before a job is fully confirmed, payouts tied to those jobs could roll over and land three or four days late, with no clear signal to anyone about why a number that should have shown up did not.
None of that made the incentive plan wrong. The metrics and payout structure underneath it were sound. But a plan that technicians cannot see clearly and cannot trust to be current might as well not exist for the purpose of actually motivating anyone day to day. A bonus a tech only thinks about on payday is not shaping behavior out in the field. It is just a paycheck surprise, good or bad, arriving a couple weeks after the work that earned it.
Getting The Numbers Out Of The Spreadsheet And Onto A Screen
The fix was not a better spreadsheet template or a more disciplined update schedule. It was pulling live leaderboards directly from the company's ServiceTitan data and putting them somewhere technicians would actually see them throughout the day: a screen in the shop, rotating through metrics automatically instead of sitting static behind a login only the office staff used. Automated dashboards replaced the manual entry entirely, so hourly rates, job completions, and award progress updated on their own as ServiceTitan data changed, instead of waiting for someone to have time to type them in.
One detail made a bigger difference than it might sound like on paper: an admin impersonation view, letting managers see the exact same screen a technician sees, logged in as that technician instead of guessing at what the dashboard showed from an admin's-eye view. That closed a surprisingly common gap. It is one thing to build a dashboard you believe is clear. It is another to actually look at it through a specific technician's login and confirm the number they are seeing on a Tuesday afternoon is the number you think they are seeing. Small formatting issues, confusing labels, or a metric that reads differently depending on account permissions are the kind of thing that only shows up once you check from the technician's actual seat.
The install team got its own job-level award breakdown on top of the general leaderboard, since install work does not fit neatly into the same per-hour or per-ticket structure that works for service calls. A single install job might be a technician's whole day, and burying that inside a generic leaderboard metric would have hidden more than it revealed. Breaking install awards out by job let each install tech see exactly which jobs were contributing to their number, instead of a single blended figure that told them very little about which of their last several jobs actually mattered for pay.
The numbers moved in the direction you would hope once the system replaced the spreadsheet. On the membership, review, and spiff plan, monthly payouts climbed from $521 in the first confirmed month to $944 two months later, before settling at $880 the month after that, real money tied to real completed work instead of a total someone had to remember to tally by hand. On the service technician plan, the first confirmed month came in at zero once the new plan went live and mappings were still settling in, then jumped to $1,458 the very next month once everything was properly connected and flowing. That kind of jump, from nothing to a real number in a single cycle, is exactly what you want to see when a broken tracking process gets replaced with one that actually works.
Fixing The Financed Job Delay Specifically
The financed job issue deserved its own fix, separate from the general move away from the spreadsheet, because it was not really a visibility problem. It was a timing problem hiding inside a visibility problem. Financing adds a real processing step between a job closing and that job being fully confirmed in the system, and there was no way around that delay entirely. What the old spreadsheet process got wrong was treating that delay as invisible instead of accounted for. A technician would look at their numbers, not see a job they knew they had closed, and have no way to tell whether it was missing because of the normal financing lag or because something had actually gone wrong.
Once standings synced live from ServiceTitan instead of a manually maintained sheet, that distinction became visible instead of hidden. A financed job still takes the time it takes to confirm, but a technician can now see it sitting in a pending state rather than simply not existing on their dashboard at all. That is a small difference in mechanics and a large difference in trust. Nobody minds a normal processing delay they can see and understand. What erodes trust is a number that is just quietly absent with no explanation, which is exactly what the old spreadsheet process produced every time a financed job came through.
Why Payday-Only Visibility Was The Real Problem
It is worth sitting with why a spreadsheet updated correctly, if inconsistently, was still holding the company back even when the underlying math was not wrong. Incentive pay works by connecting a specific action, a completed job, a clean install, a strong review, to a specific reward, closely enough in time that a technician can feel the connection. A dashboard only trustworthy on payday breaks that connection almost completely. By the time a tech sees the number, the jobs that produced it are two or three weeks old, blurred together with everything else that happened since. The incentive stops functioning as a real-time signal and starts functioning as a lagging report card nobody can act on anymore.
Putting live standings on a screen in the shop fixes that by shortening the distance between doing the work and seeing it reflected in your numbers, down to the same day in most cases. A technician who closes a strong job in the morning can see it show up on the leaderboard that afternoon. That is a completely different experience than waiting two weeks to find out whether a good month actually was a good month. It turns the incentive plan from a monthly surprise into something a technician can actually manage their own performance against, in real time, the same way they would check a scoreboard during a game instead of only finding out who won after it ended.
Profit sharing
made simple.
Give your team a stake in the company’s success. ShareWillow helps you create and manage profit-sharing programs that motivate employees and drive business results.
What This Means For Other HVAC Shops Running Manual Trackers
A surprising number of HVAC companies are running some version of the same setup this company started with: a well-designed incentive plan sitting on top of a manually maintained spreadsheet, Google Sheet, or whiteboard that someone in the office has to remember to update. The plan design is rarely the weak link in that chain. The update process is. And because a spreadsheet degrades quietly, a missed update here, a stale hourly rate there, most owners do not notice the gap until a technician asks why their number looks wrong, or stops trusting the number enough to bother asking at all.
The fix is not asking whoever maintains the spreadsheet to be more careful. It is removing the manual step completely, so the numbers technicians see are pulled directly from the same field service software already generating the underlying job data. If your shop is still re-typing hourly rates by hand, still only checking standings once a month, or still cannot explain why a financed job's payout landed a few days later than expected, that is not a minor inconvenience to tolerate. It is the same gap this company closed, and closing it is what turned a Google Sheet nobody fully trusted into a screen on the shop wall that every technician can check, and believe, any day of the month.
A Screen Instead Of A Spreadsheet, And What That Actually Changes
The company is now in the process of retiring its Google Sheet entirely, not because the sheet was doing serious damage, but because there was finally nothing left for it to do. Every number it used to hold by hand now updates on its own, synced from the same ServiceTitan data the office was already using to run the business day to day. What is left behind is not a fancier spreadsheet. It is a shop where a technician can glance at a TV between jobs and know, right then, exactly where they stand, instead of waiting until the fifteenth of the month to find out whether the work they already did was going to show up correctly on their paycheck.
That shift, from a document someone has to remember to update to a system that simply reflects reality as it happens, is a small technical change with an outsized effect on how much a technician actually trusts their own incentive plan. Trust is not built by a generous bonus structure alone. It is built by a technician being able to check their own numbers whenever they want and get the same answer the company would give them, every single time, without a spreadsheet, or a person, standing in the way.
Related reading
Conclusion
The spreadsheet is being phased out entirely. Technician payouts on two of the company's plans grew month over month once standings synced live from ServiceTitan, and every tech can now see exactly where they stand on a screen in the shop instead of waiting for payday.
Create incentives
that
drive results
You shouldn't need complex equity plans to align your team. ShareWillow makes it simple to create transparent profit-sharing programs that motivate employees and grow your business.

Incentive plans to help
small businesses thrive.
.png)
"I was able to leverage the knowledge of the ShareWillow team to learn how other companies were designing their bonus plans. The template was extremely helpful."

Brian Tustin
Owner, First Rate Movers